Ah, the mighty Bitcoin, the king of crypto, has decided to take a nap on its leather throne, snoring softly at $90,828 as of January 11, 2026. 🛏️ With a 24-hour yawn stretching between $90,291 and $90,850, it’s clear the monarch is in no rush to conquer new realms. A market cap of $1.81 trillion and a daily trading volume of $14.26 billion? Just the king’s pocket change, my friend. 👑💰
Bitcoin Chart Outlook: A Tale of Boredom and Crab Walks 🦀
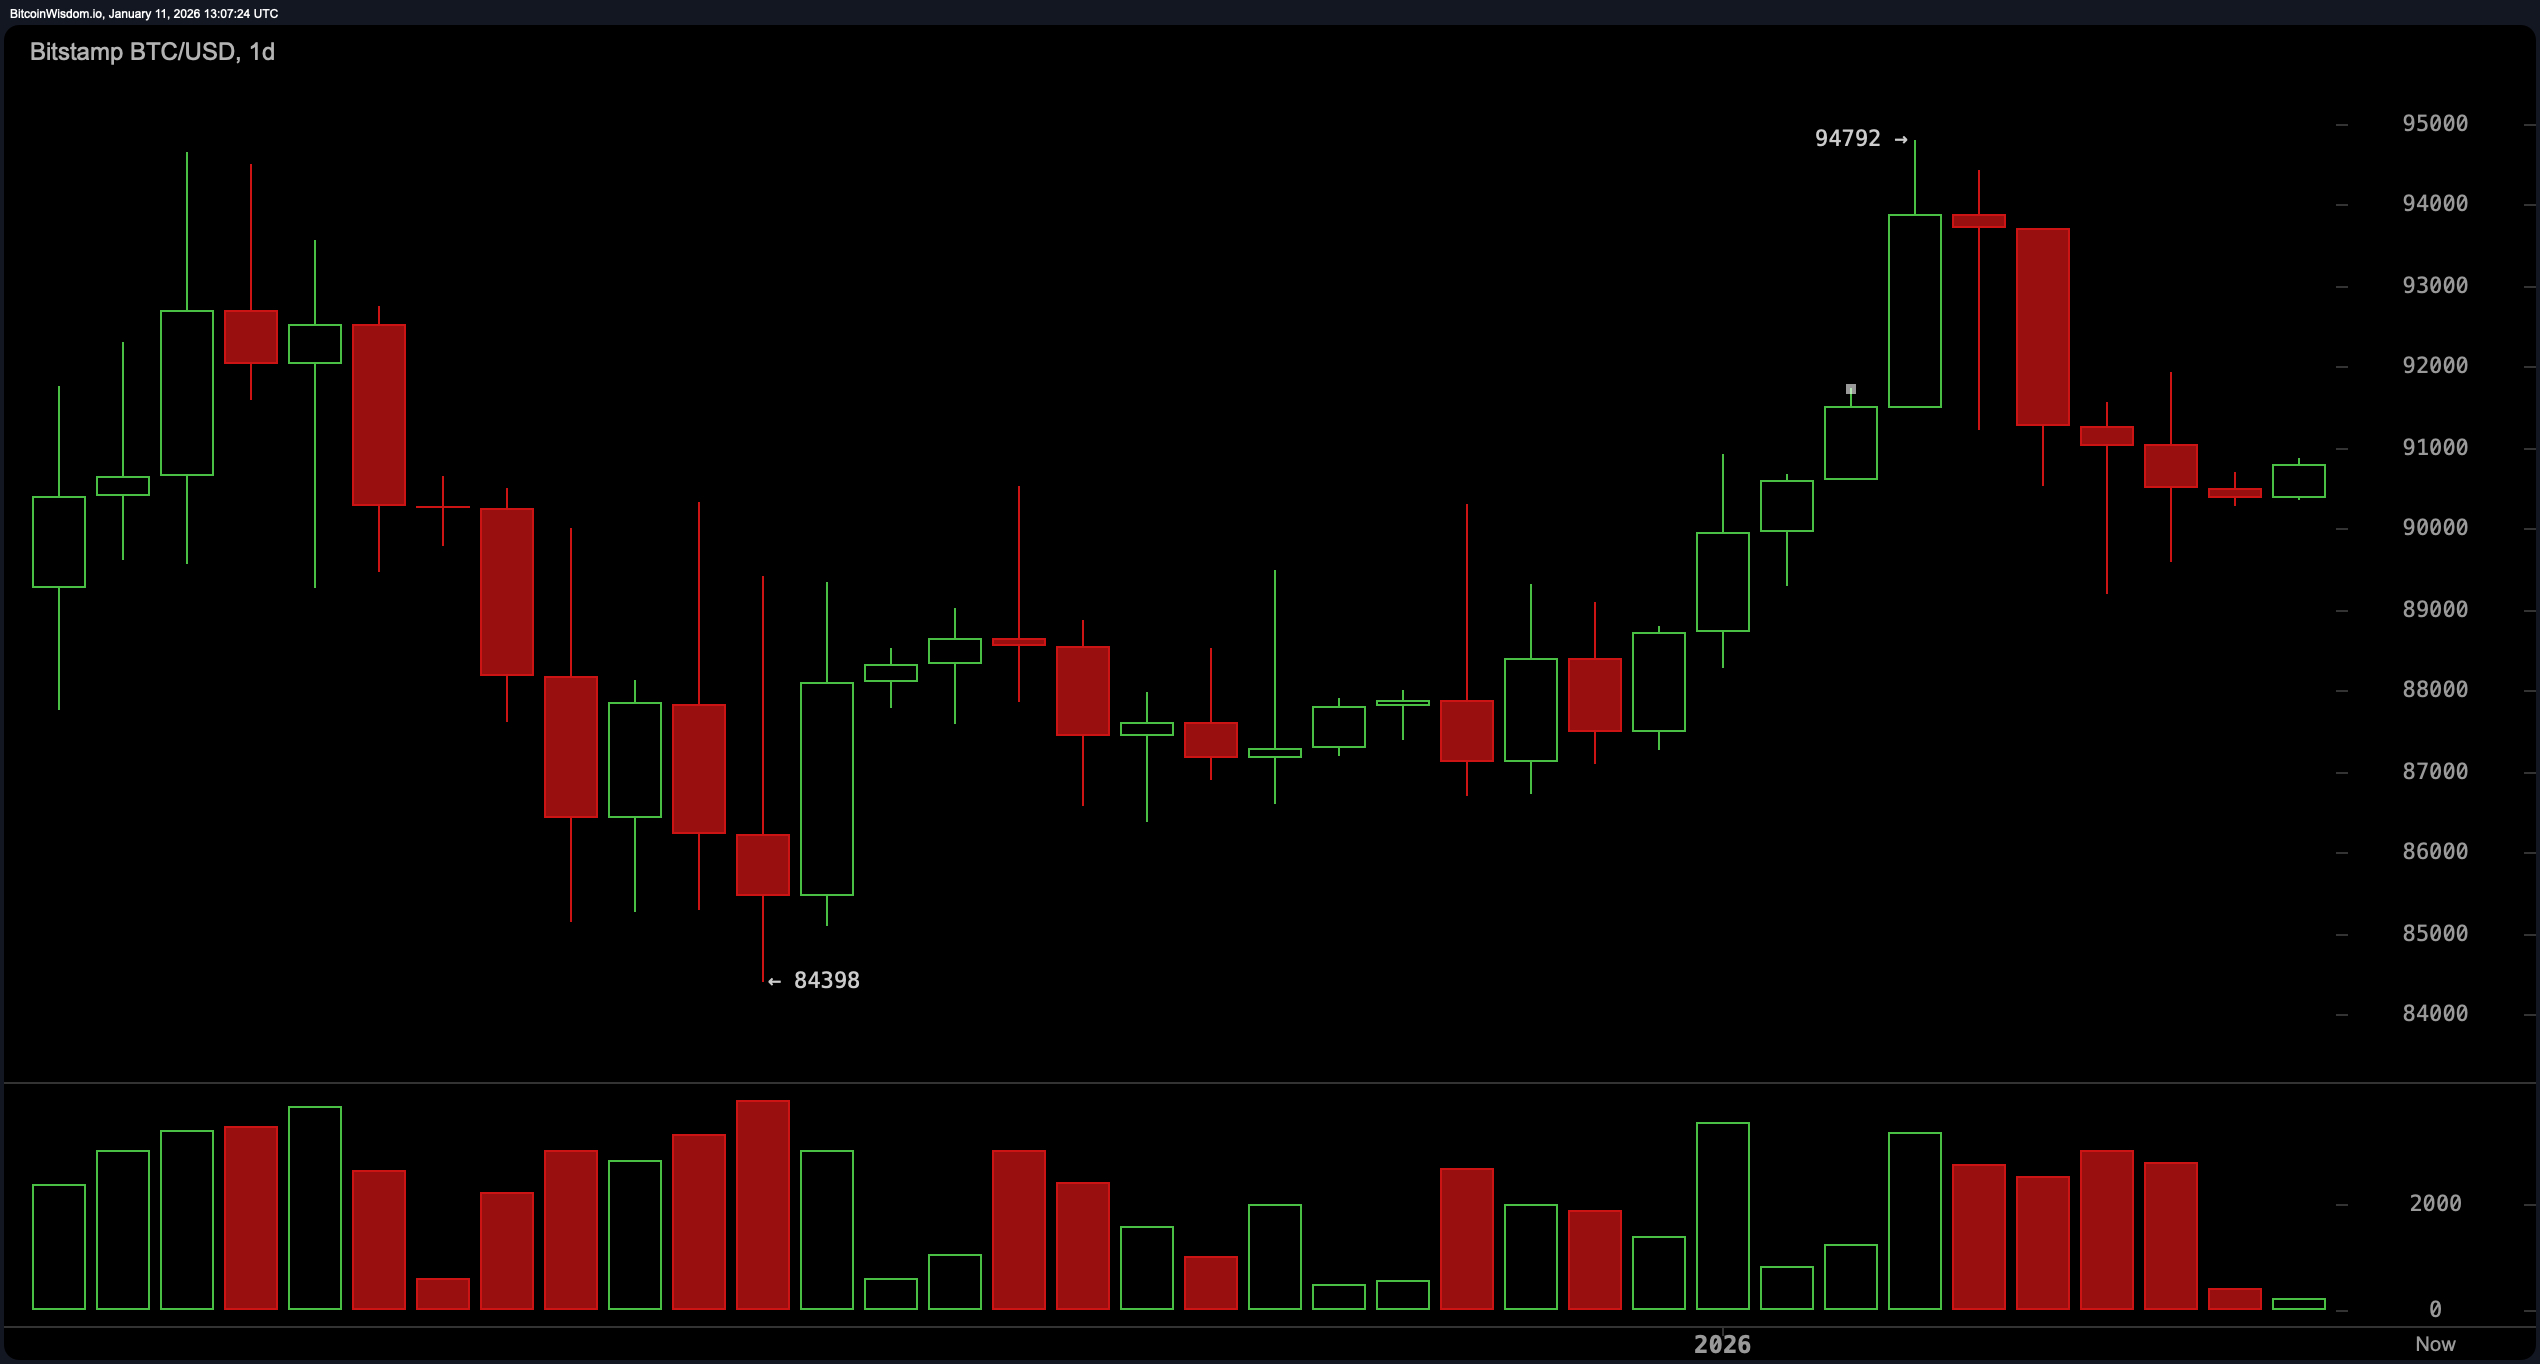
From the daily chart, our dear Bitcoin is trying to shake off a recent slump, bouncing like a V between $84,398 and $94,792. Now, it’s hovering around $90,500, with candles so small they’re practically whispering, “Meh.” 🥱 Support? Oh, it’s cozy between $84,500 and $85,000. Resistance? A cool $94,500 to $95,000. Bulls? Still nursing their weekend hangover. 🍻
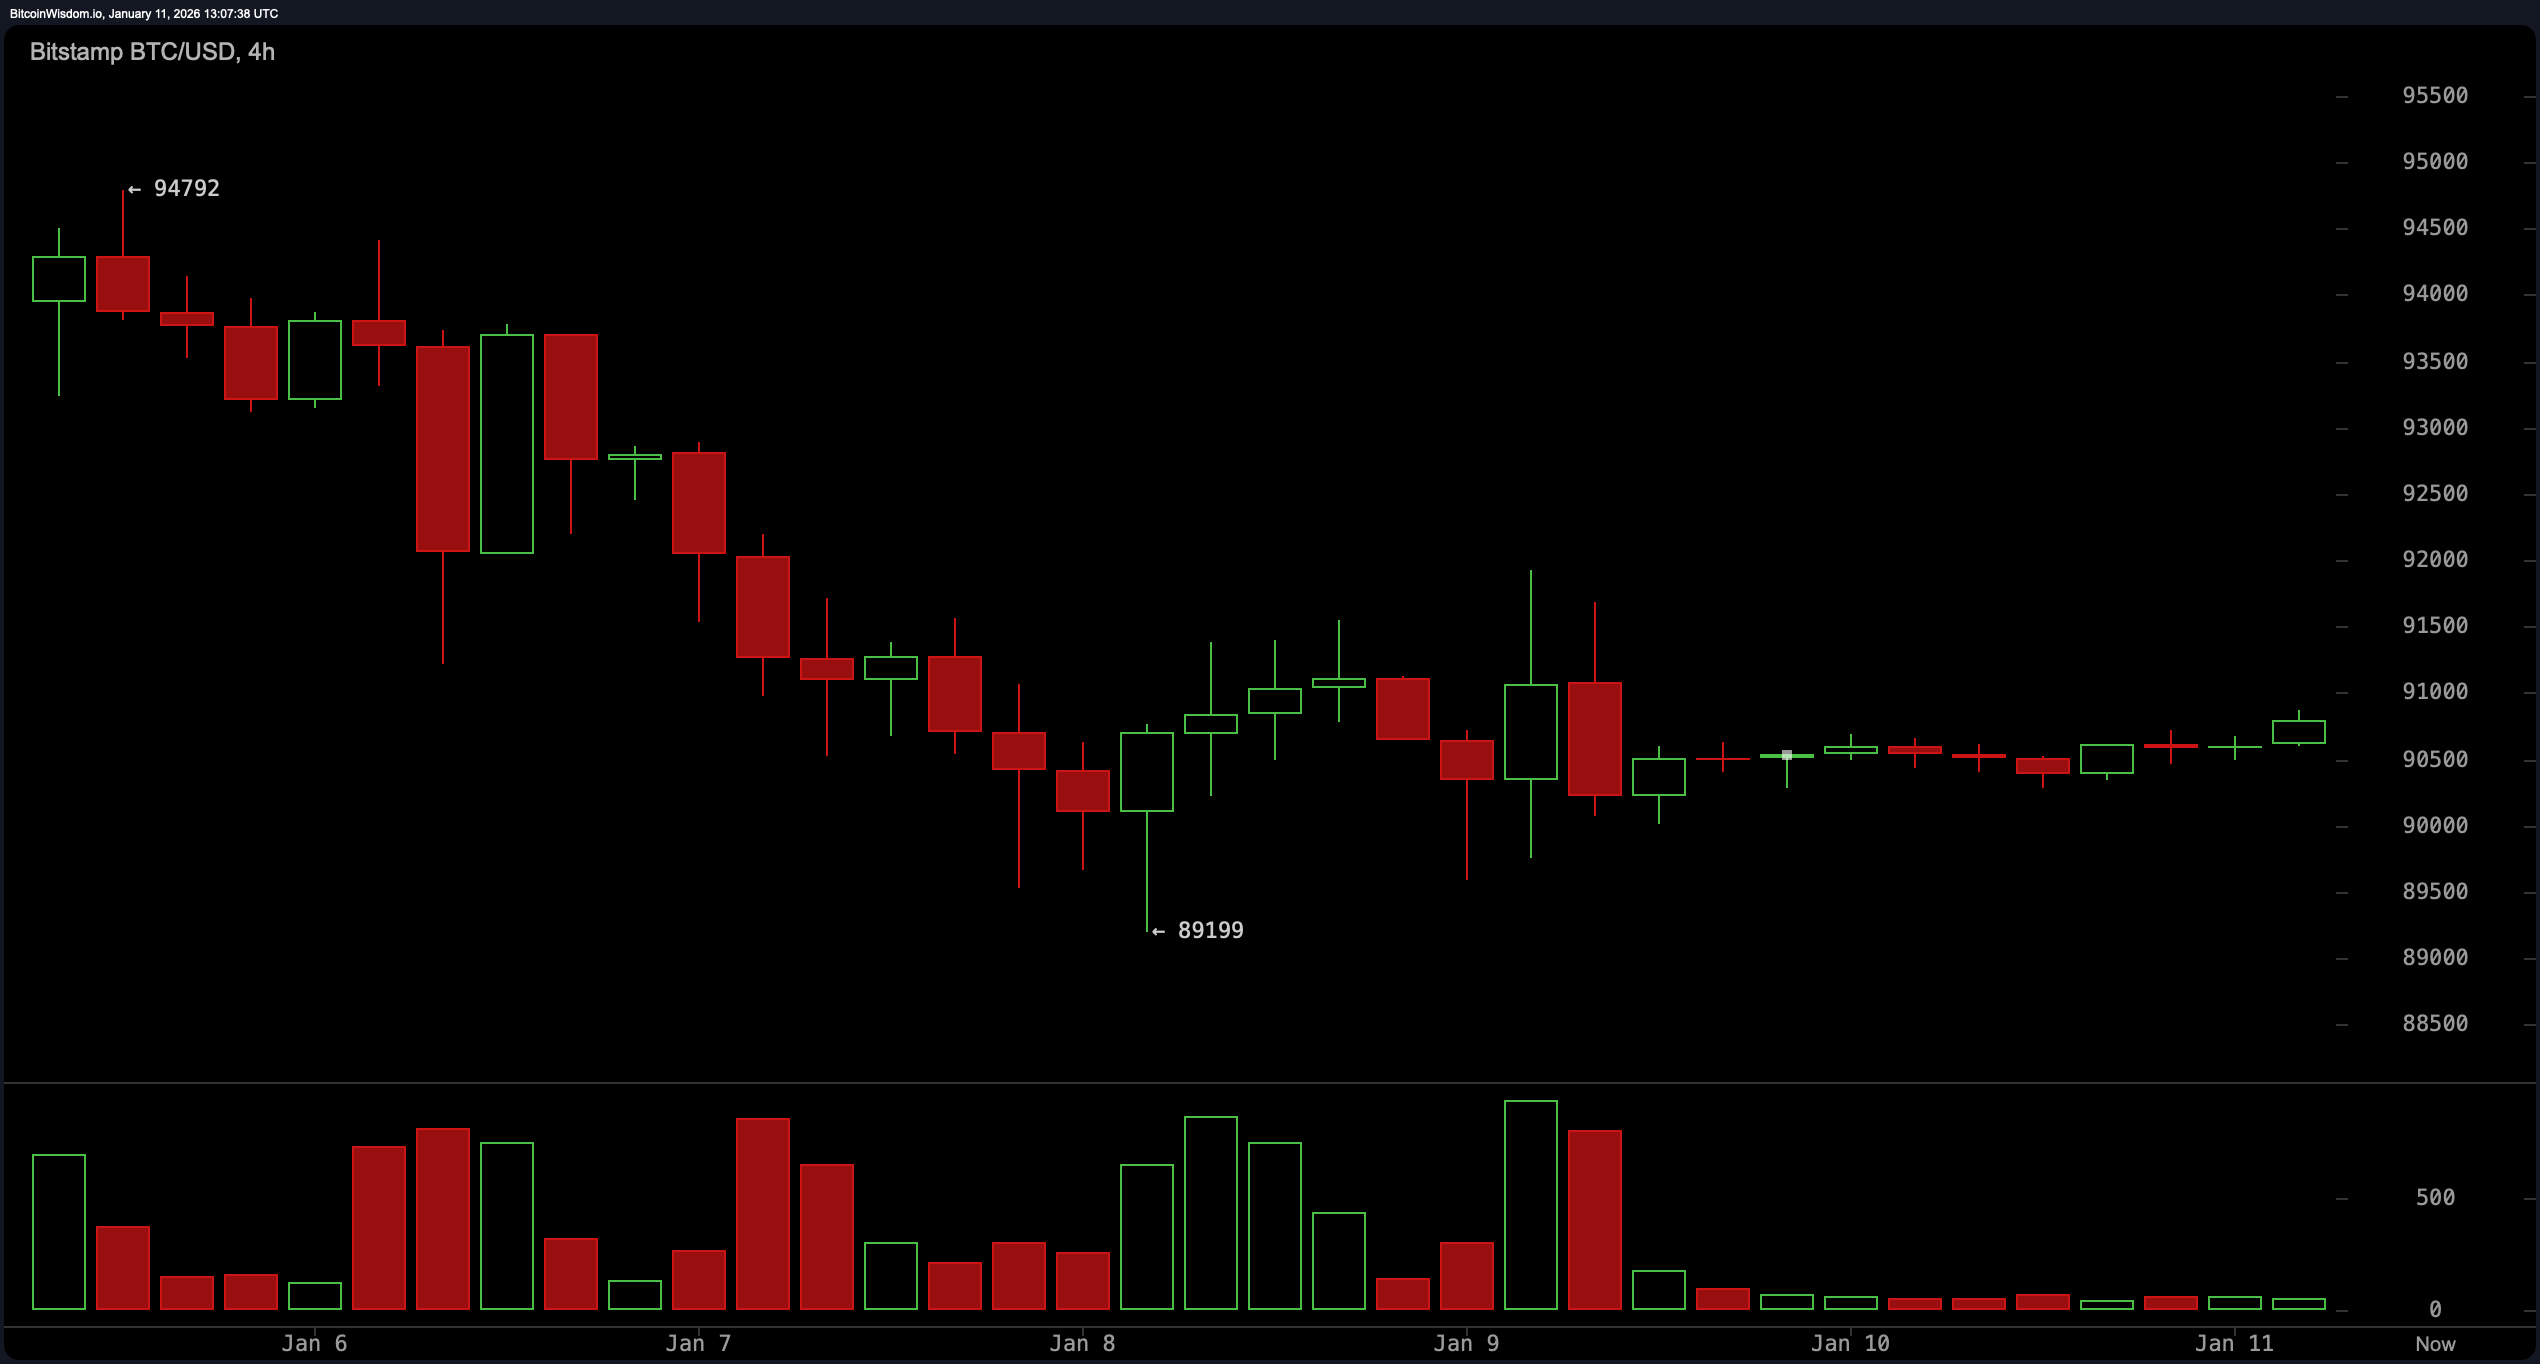
On the 4-hour chart, Bitcoin’s sideways shuffle resembles a crab on roller skates-equal parts hilarious and frustrating. 🦀🛼 A recent slide found its footing at $89,199, with a bottoming tail hinting at a flicker of interest. Now, it’s stuck in a descending channel that’s leveling out faster than a socialist’s promises. Volume? Trickling like a leaky faucet. Neither bulls nor bears are ready for a showdown-just a lot of staring contests. 👀
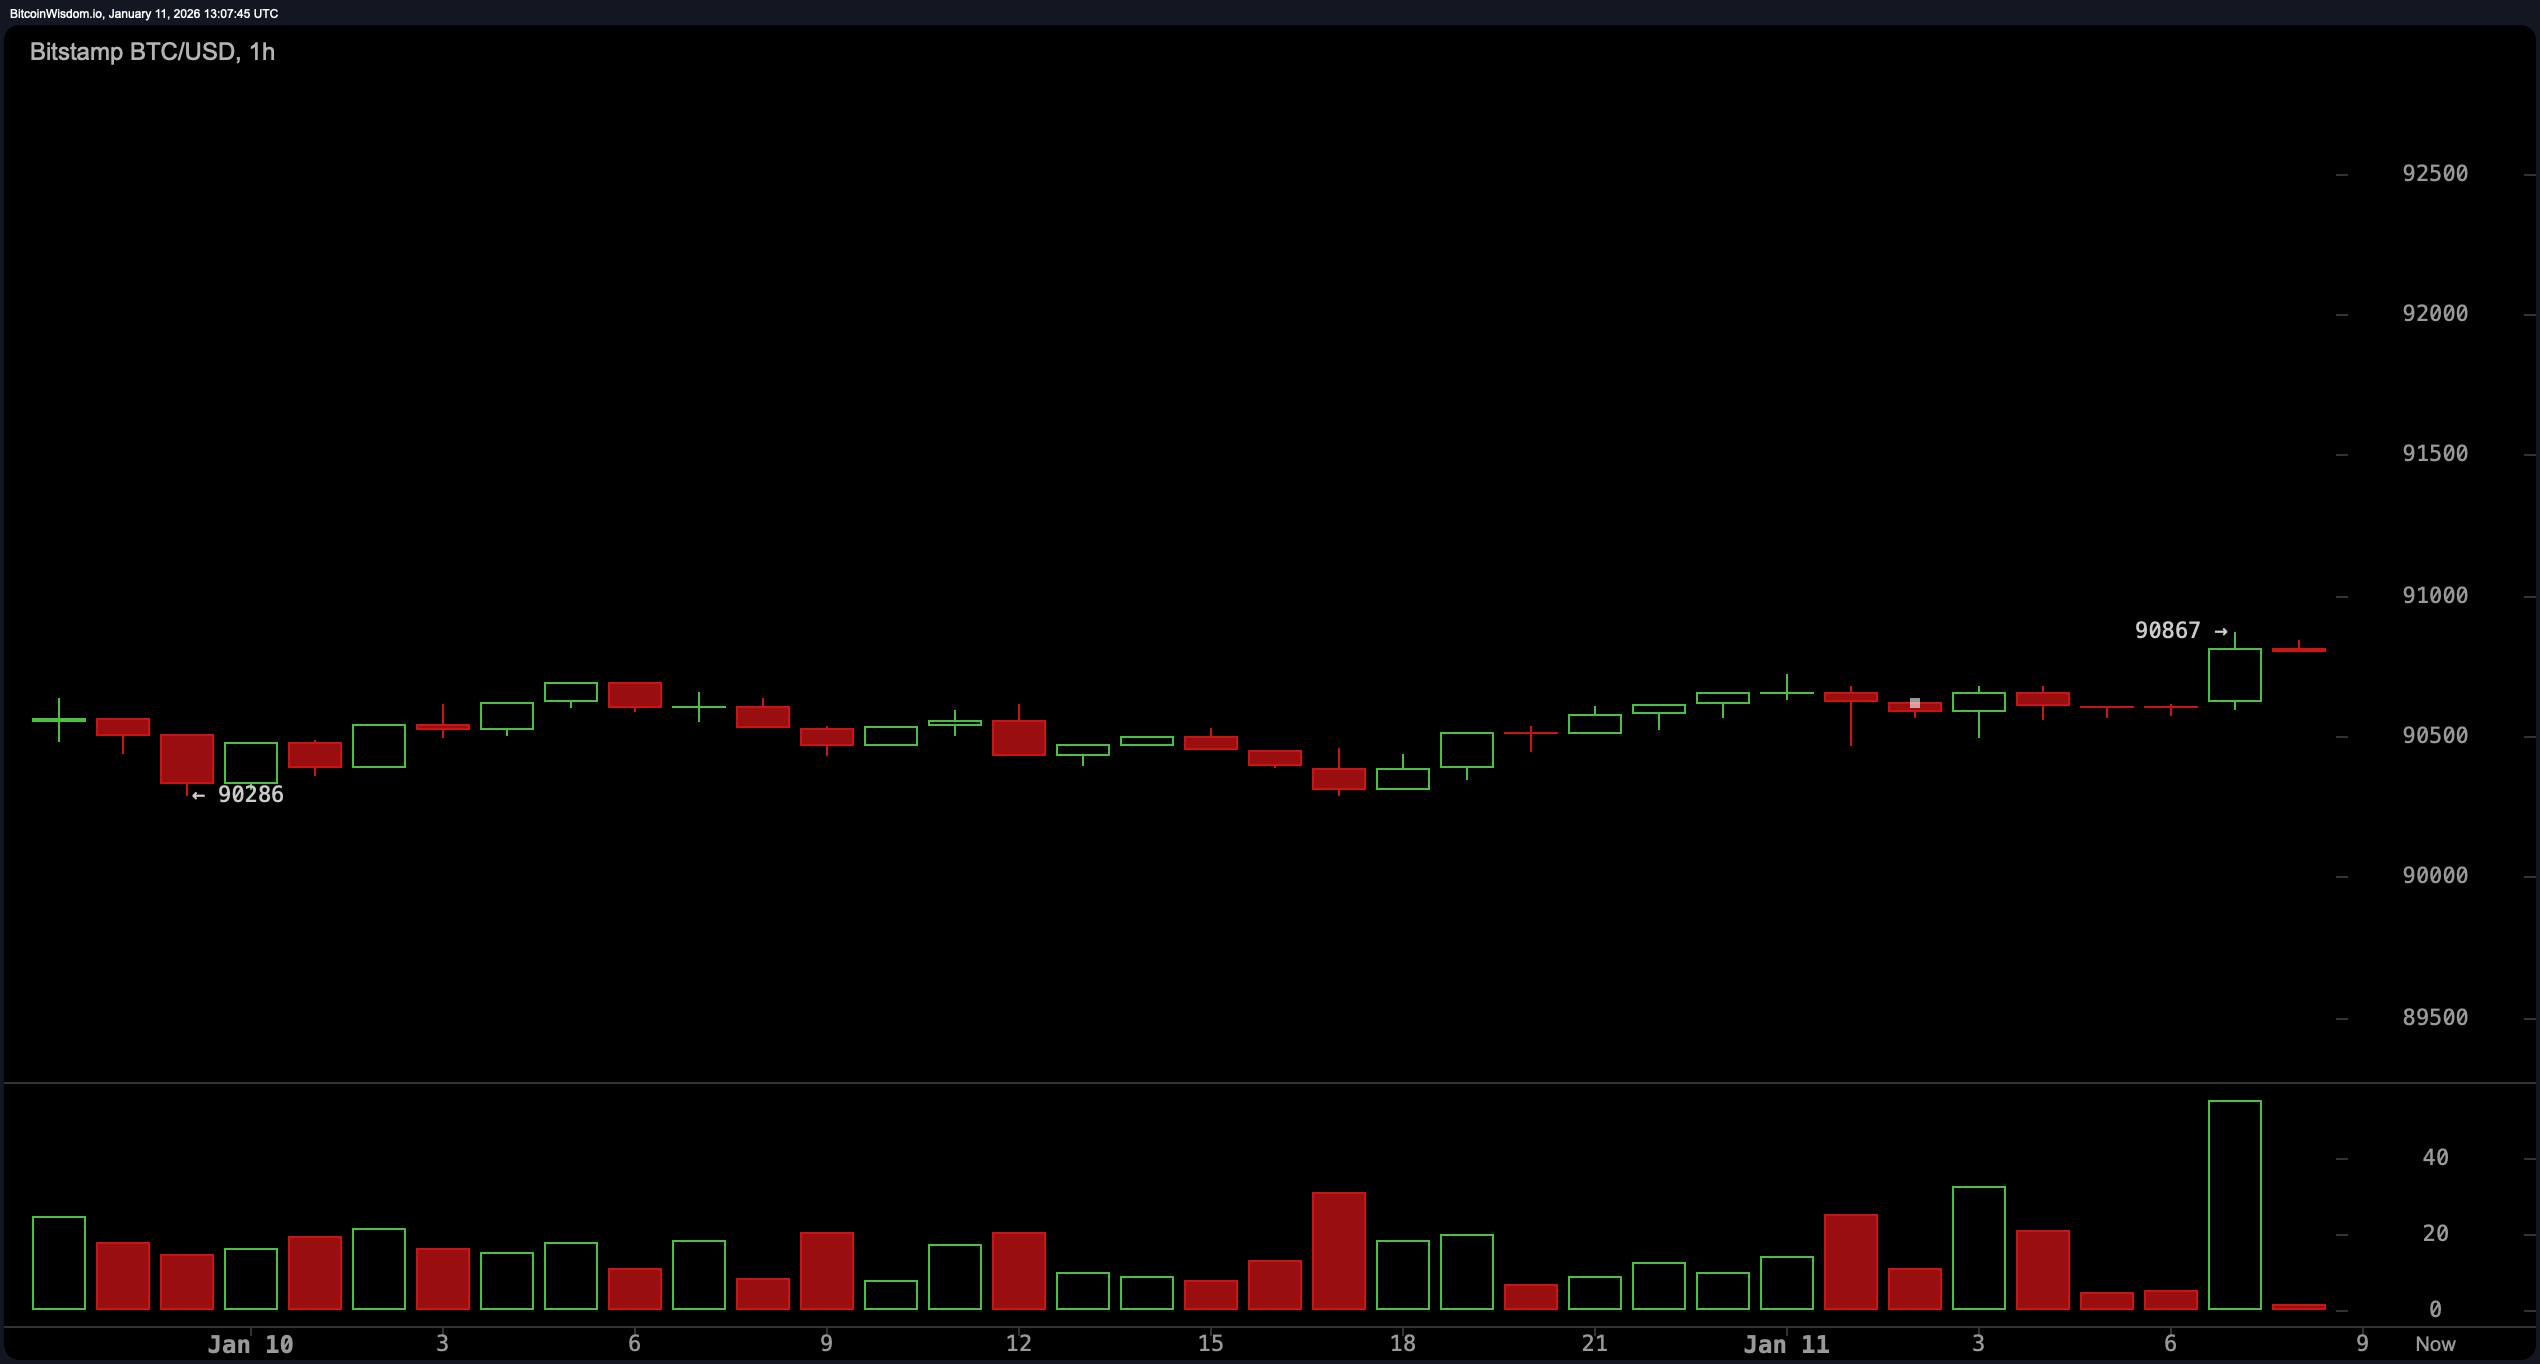
Zoom into the 1-hour chart, and Bitcoin’s in a $600 straitjacket. A recent bounce to $90,867 with a volume spike? Just a flirtation. Without a breakout above $91,000 backed by strong volume, it’s all just crypto theater. A rounding bottom? Maybe. Accumulation? Perhaps. Confirmation? Nowhere to be found. Scalpers are twitching, but if volume fizzles, this rally will deflate faster than a January party balloon. 🎈💨
The oscillators? They’re shrugging. RSI at 53? Neutral. Stochastic at 48? Neutral. CCI at 46? Neutral. ADX at 25? Weak trend. Momentum at 2,078? Bearish. MACD at 475? A whisper of bullish hope. Overall, they’re singing, “We’ll get back to you.” 🎤🤷♂️
Moving averages? A mixed bag of sarcasm. Short-term EMAs and SMAs are bullish, but the long-term ones? Bearish as a winter storm. 100-period EMA and SMA at 96,084 and 98,210? Bearish. 200-period EMA and SMA at 99,744 and 106,258? Bearish. Long-term outlook? More fizzle than pop. 🍾💥
In sum, Bitcoin’s playing it cool with a slight bullish undertone, but traders, keep your eyes on $89,000 and $91,000. Breakout? Possible. Sideways stroll? Likely. Market sentiment? Cautiously curious, like a cat eyeing a new toy. 🐱🧸
Bull Verdict: ☕
If Bitcoin breaks above $91,000 with volume, it could wake up and rally. Short-term MAs and oscillators are cautiously optimistic-assuming the bulls find their espresso. Path to $94,000-$95,000? On the radar, but no guarantees. 🚀
Bear Verdict: 🌧️
If $89,000-$90,000 fails, Bitcoin could tumble to $85,000 or worse, $84,000. Long-term MAs are bearish, and momentum’s fading. Bears are circling, waiting for a slip. 🐻⚠️
FAQ ❓
- What’s Bitcoin’s price now?
$90,828 as of January 11, 2026. 💤 - Intraday range?
$90,291 to $90,850. 🛌 - Trending up or down?
Sideways with a slight bullish bias. 🦀 - Key levels?
Support at $89,000, resistance at $91,000. 👀
Read More
- USD ZAR PREDICTION
- 2026 Crypto Breakthrough? Let’s Not Panic (Yet!)
- EUR TRY PREDICTION
- TRX CAD PREDICTION. TRX cryptocurrency
- ALGO PREDICTION. ALGO cryptocurrency
- The Great Crypto Curtain Call: $27B Options Vanish in a Holiday Mirage! 🎭💸
- XRP’s Eternal Stasis: $1.58 or Bust? 💸🚀
- Bithumb’s Lost Crypto! Upbit’s Young Kings
- Bitcoin Stumbles While Altcoins Dance: A Comedy of Digital Assets!
- Bankers in Monkey Suits Are Now Miming Crypto 😱
2026-01-11 17:28