On March 12, 2026, the illustrious Bitcoin paraded at $70,523, its market cap a modest $1.41 trillion-a mere trinket in the vaults of financial ambition. Trading volume twirled at $47.04 billion, while the price flitted between $69,034 and $71,230, as indecisive as a debutante choosing a dance partner. Technical indicators, ever the drama queens, offered a cocktail of cautious optimism and mild skepticism-a party trick for the chart-reading elite.
Bitcoin’s Theatrical Performance
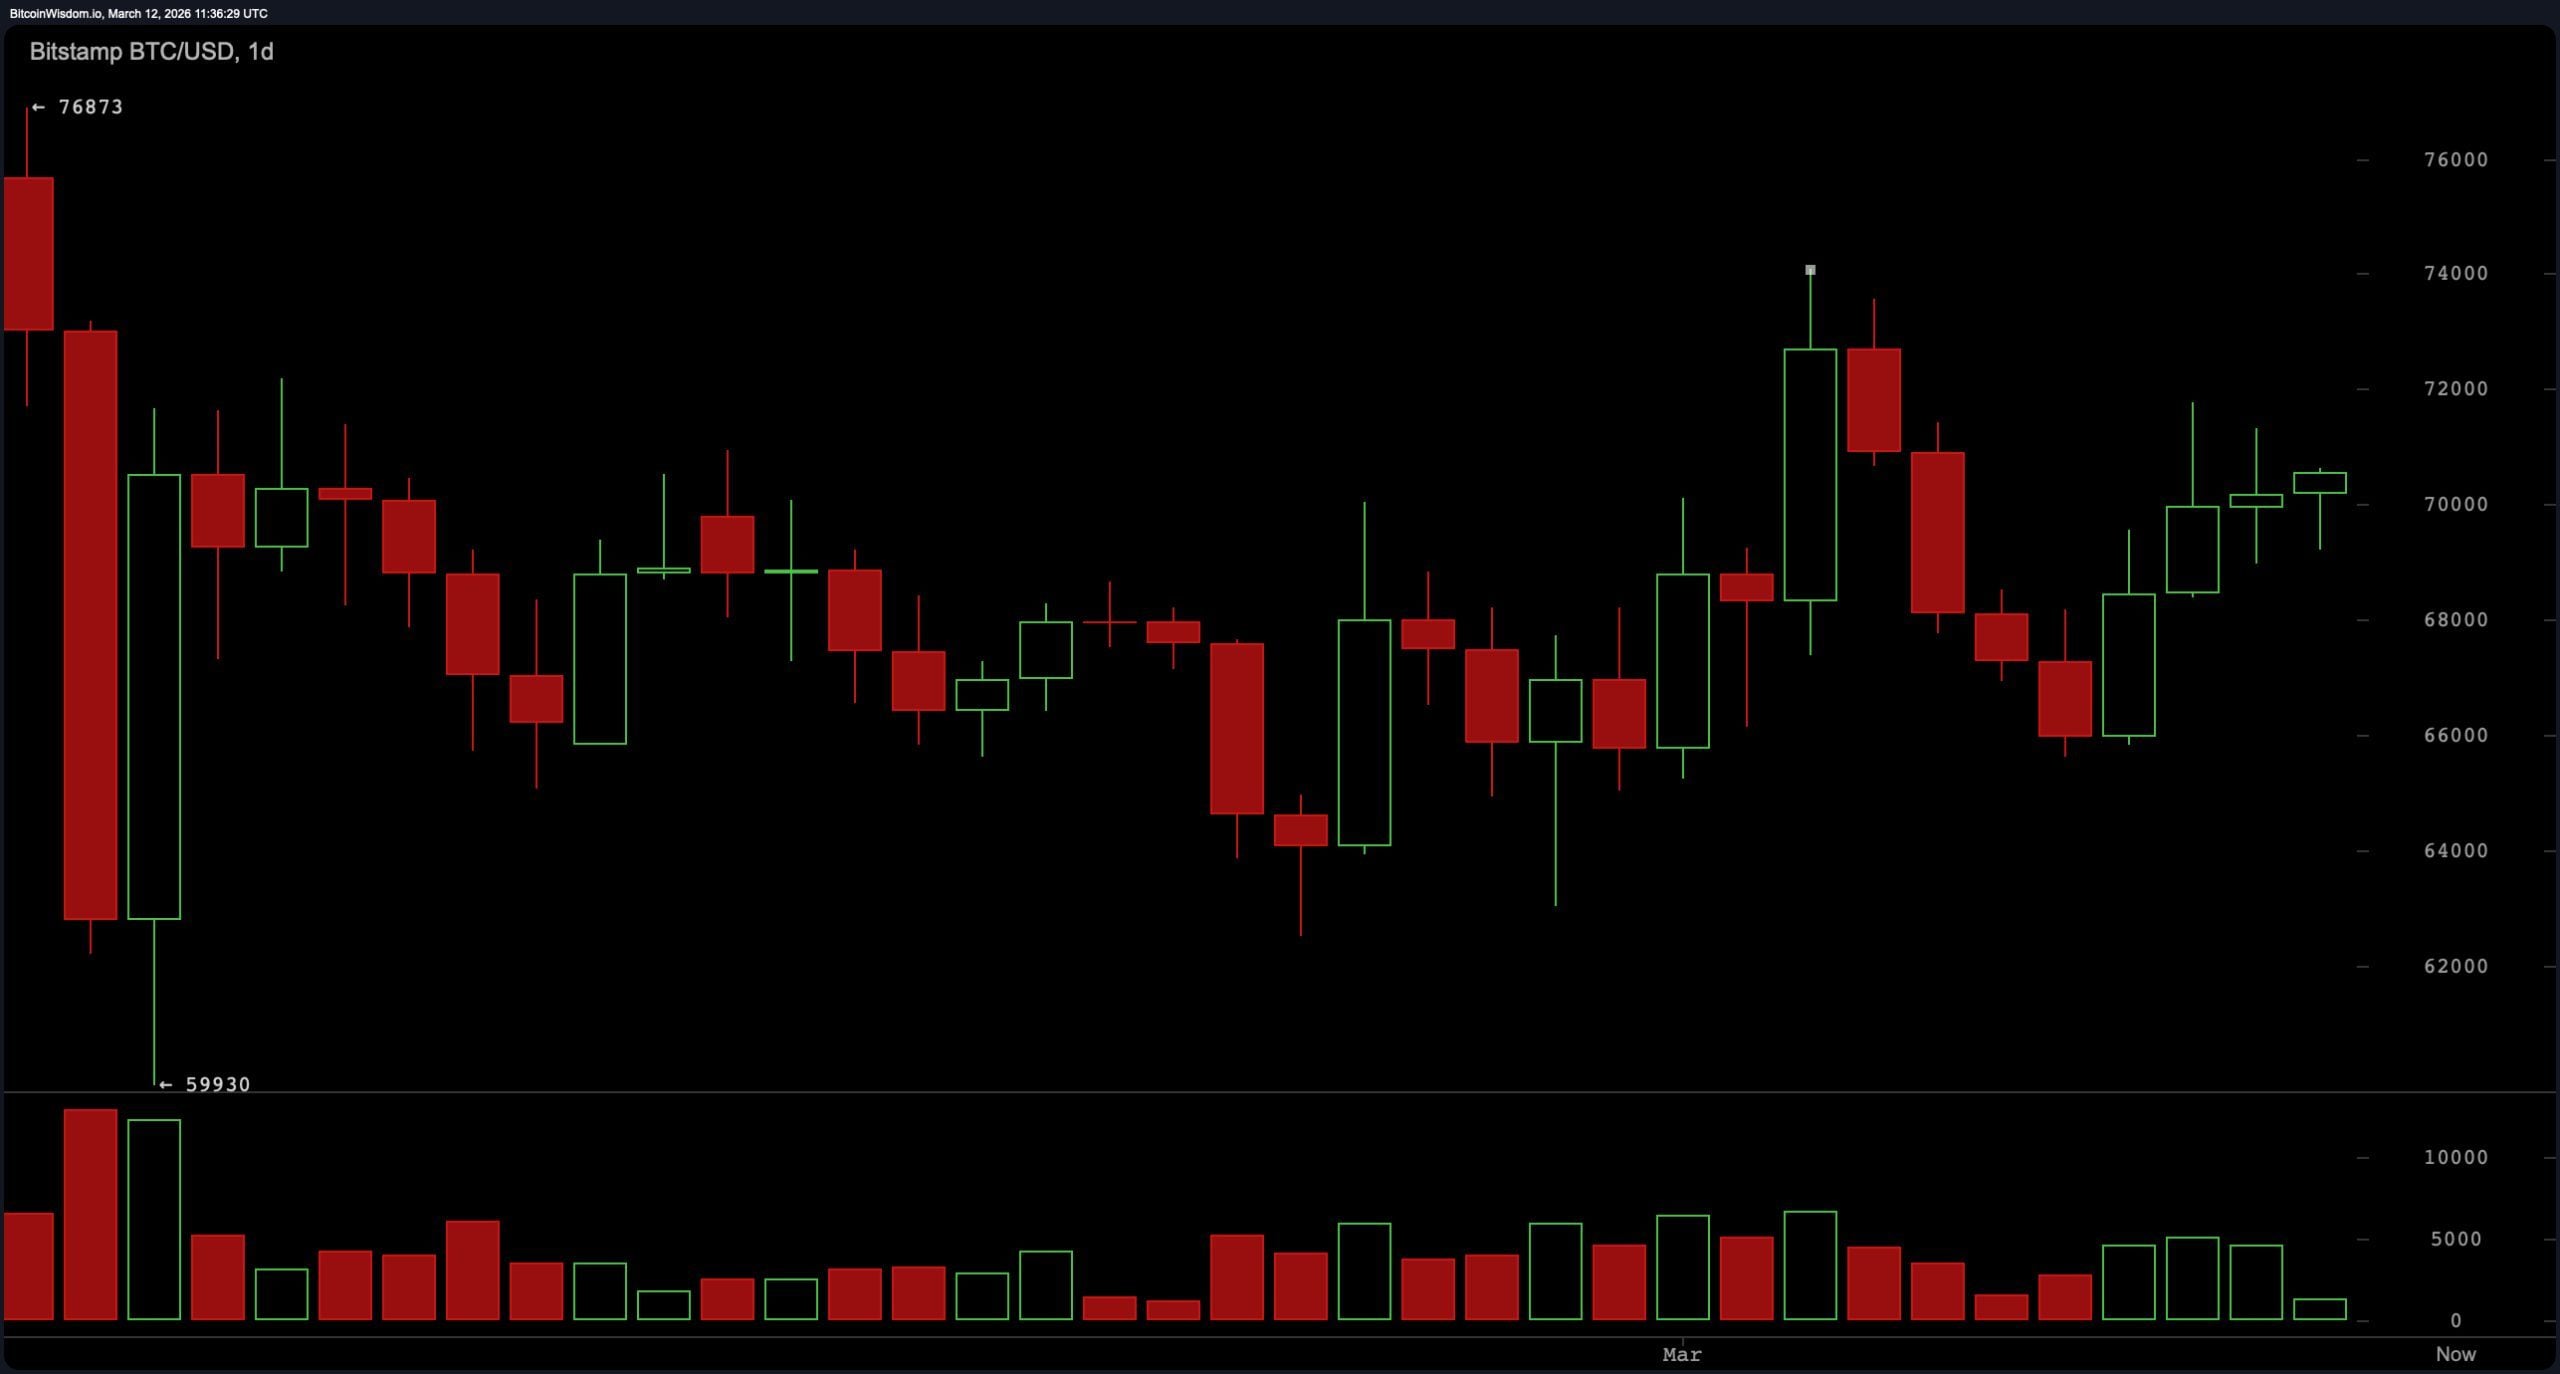
The daily chart reveals a market rehearsing for a role in “Waiting for Godot,” consolidating after a rebound from $59,900. Bitcoin’s price has pirouetted between $64,000 and $74,000, crafting a sequence of “higher lows” that whisper of demand lurking backstage. It’s the financial equivalent of a shy suitor-hinting at interest but never quite proposing.
Current price action teeters near $70,000-$71,000, the upper balcony of its recent opera house. The broader structure? A range-bound waltz, not a trending tango. Momentum indicators, ever the reluctant chaperones, refuse to pick a side-like critics who’d rather sip champagne than review the show.
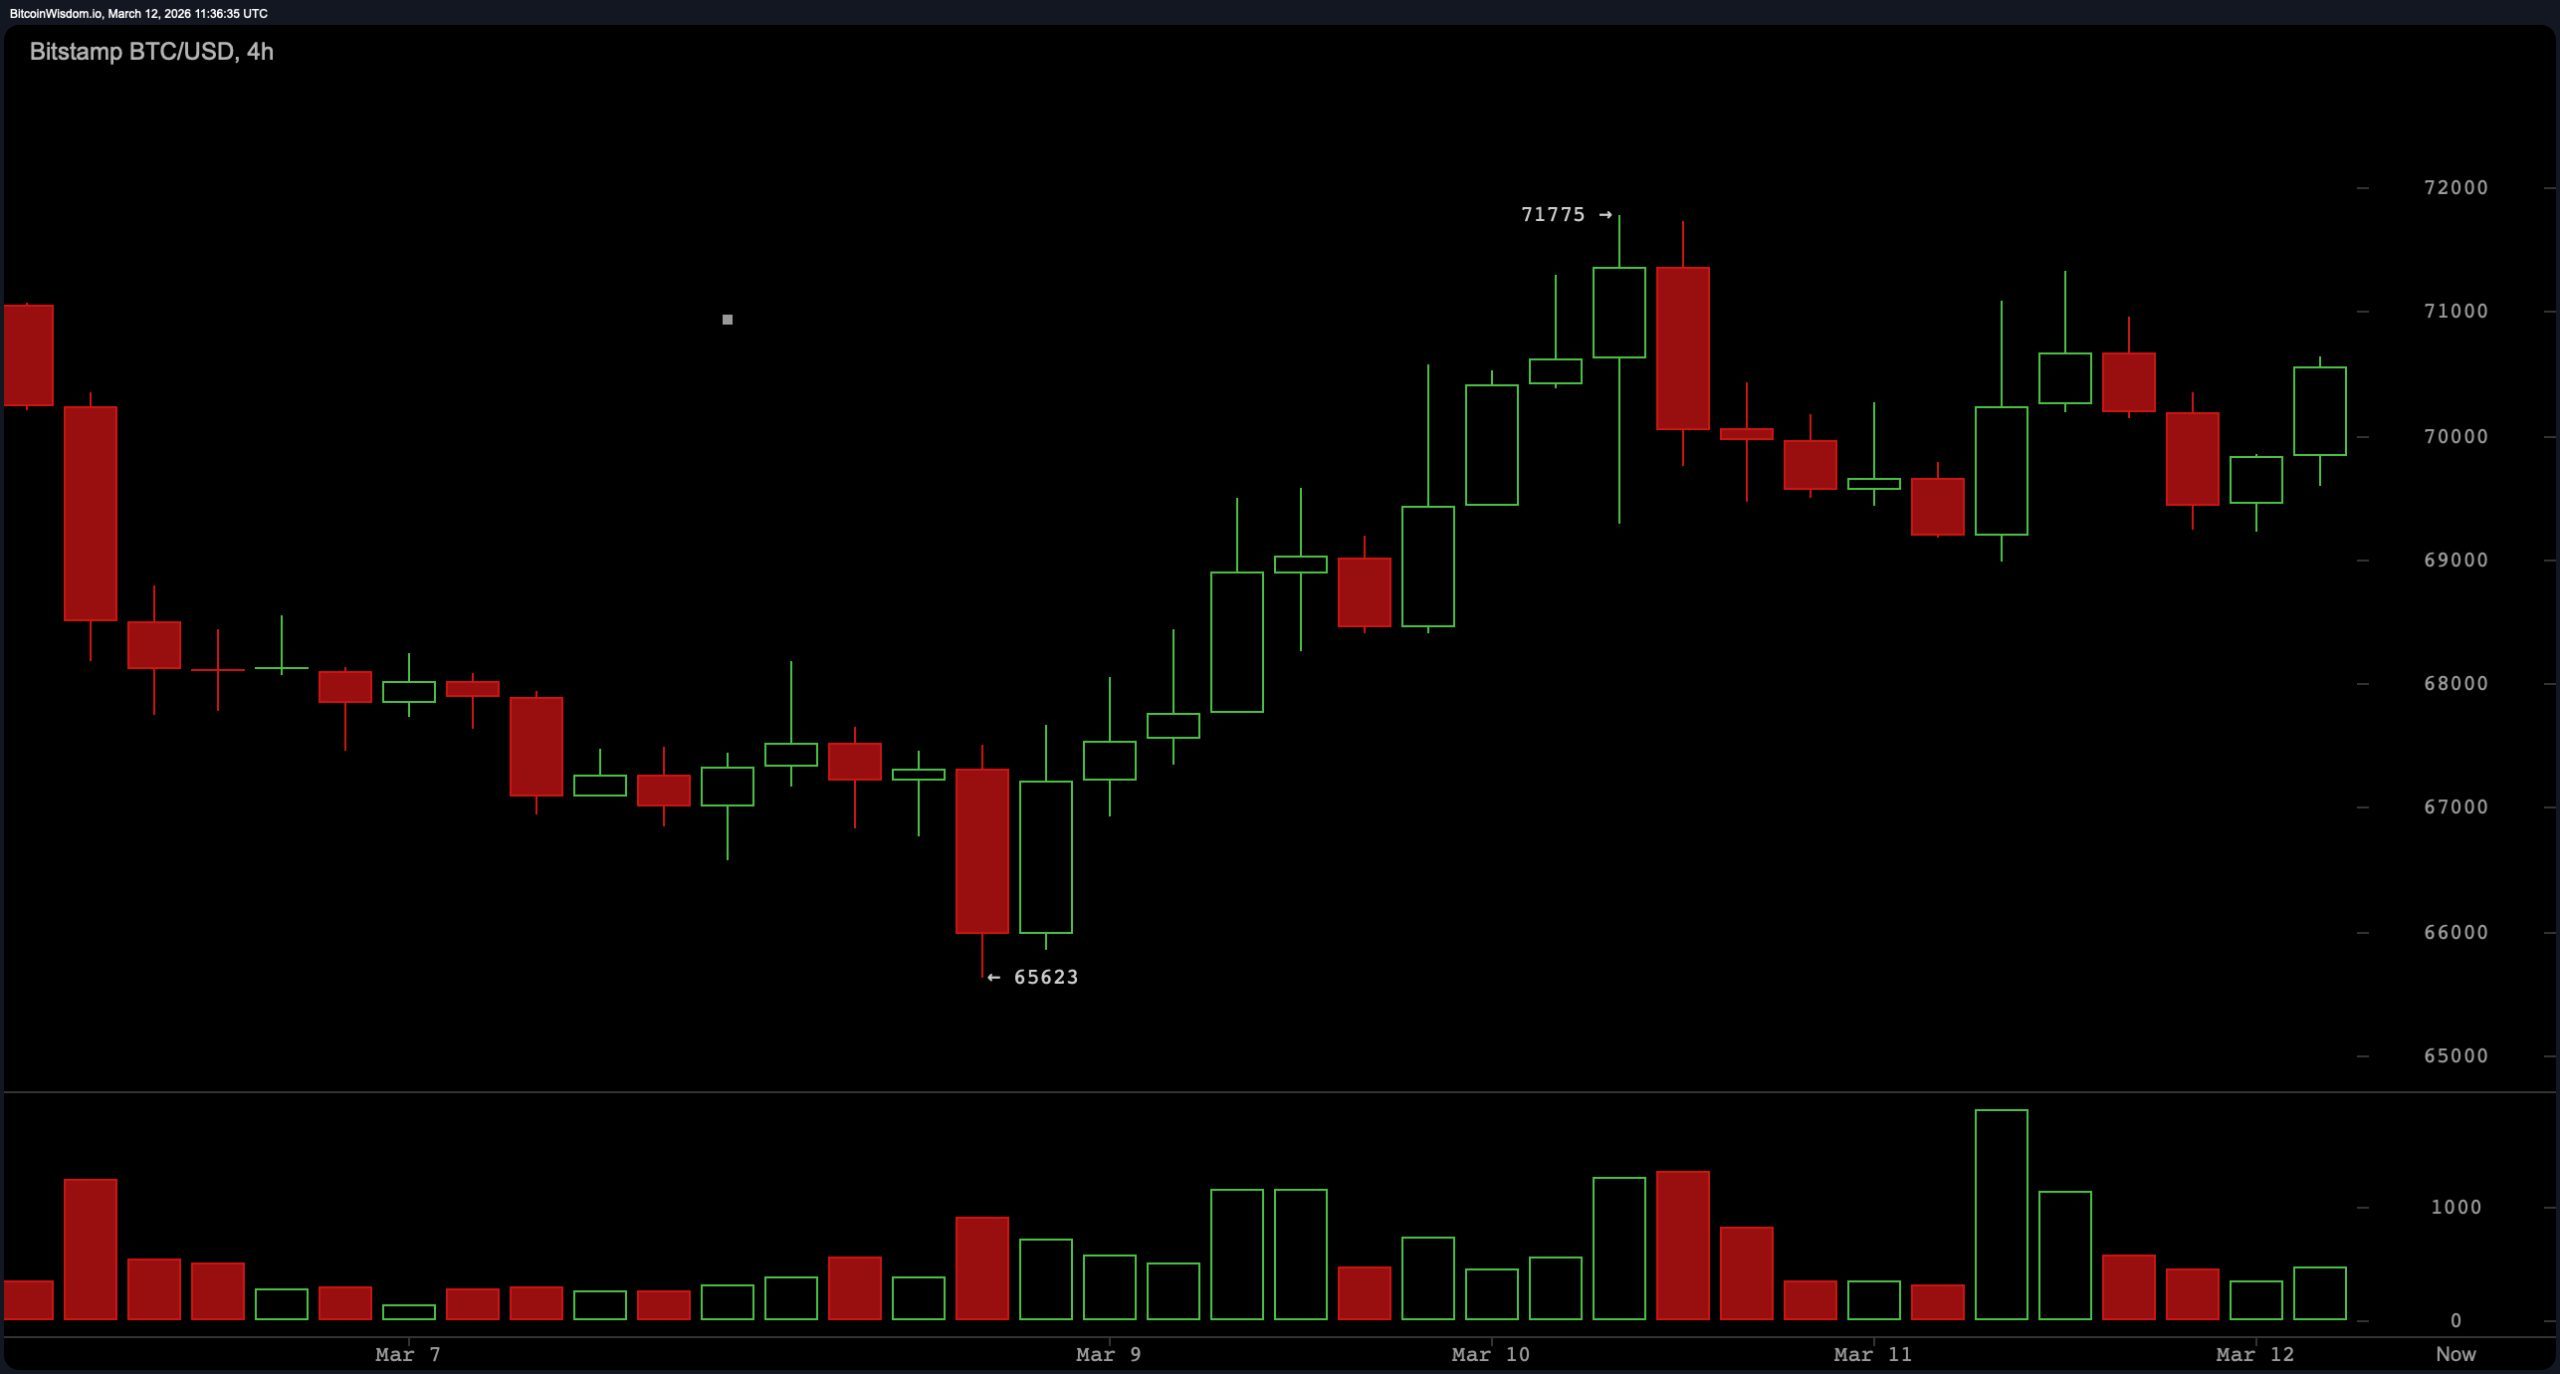
The 4-hour chart attempts a plot twist. A valiant surge from $65,600 to $71,175 collapsed into a “controlled pullback”-a euphemism for panic buying in a fire sale. Yet, the retracement stabilized near $69,000, printing higher lows like a toddler learning to walk. Resistance looms at $71,100-$72,000, a velvet rope manned by bouncers named Doubt and Fear.
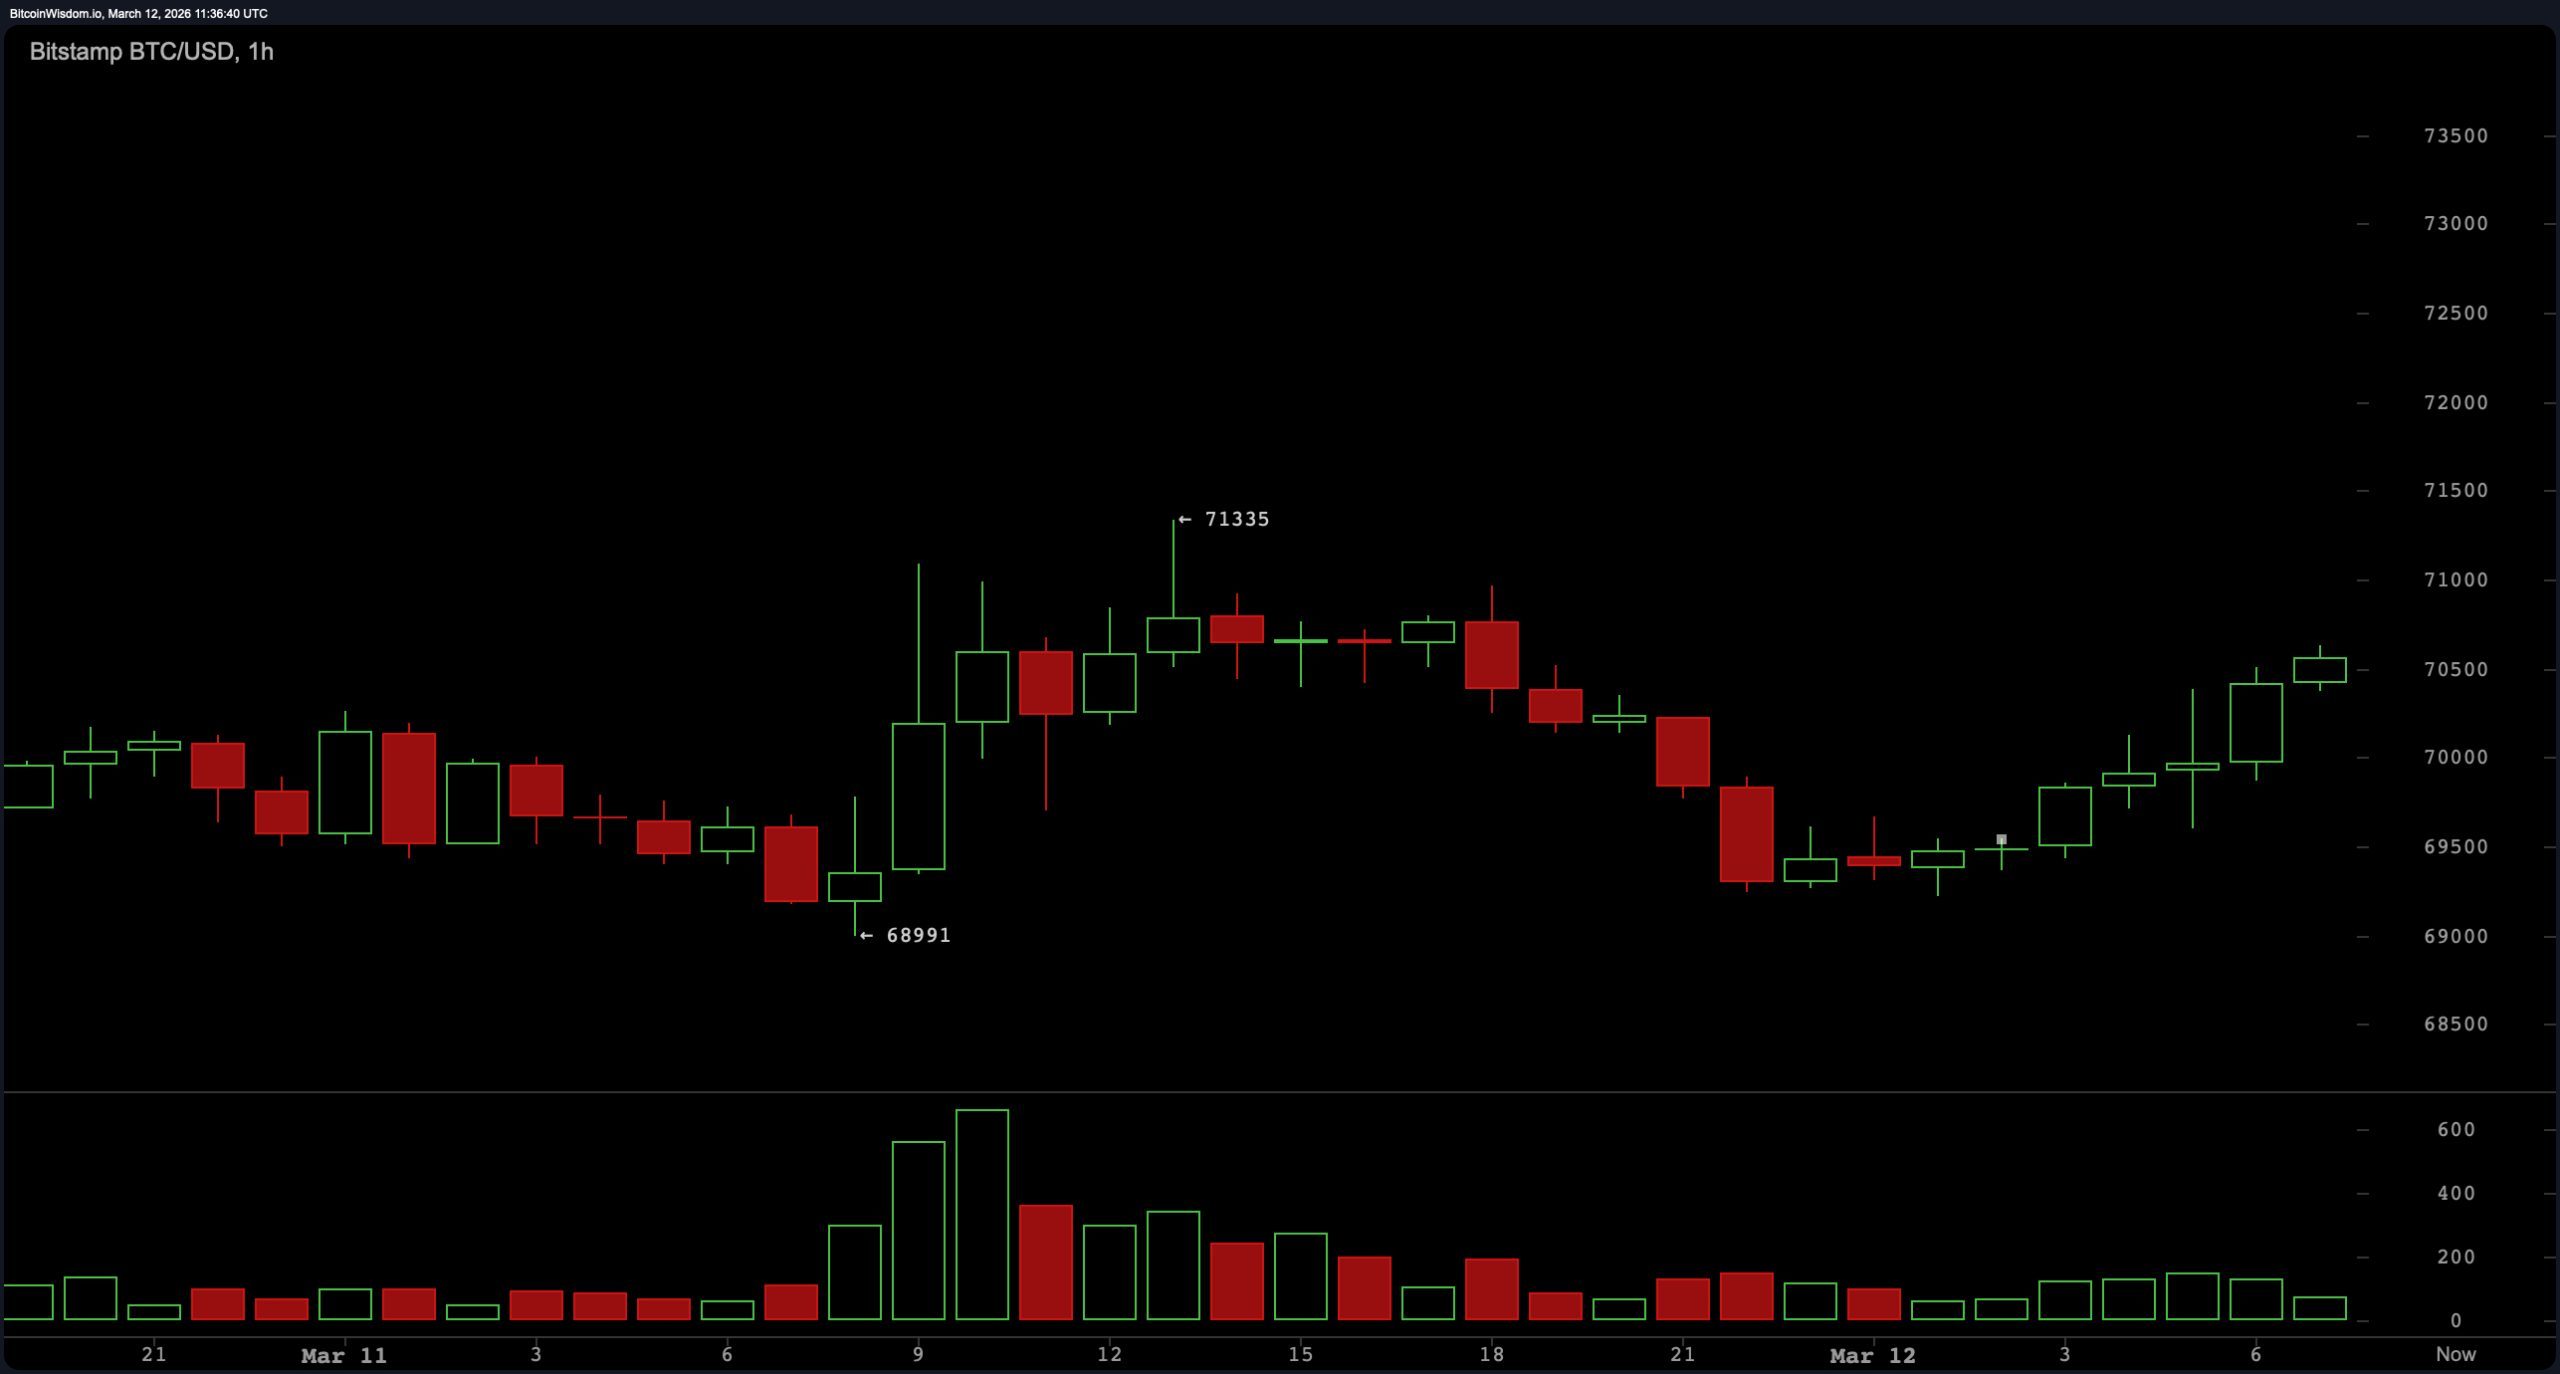
The 1-hour chart exposes the microstructure-a staircase of higher lows at $69,300, $69,800, and $70,200. Candles, small and orderly, suggest accumulation as thrilling as watching paint dry. Buyers, it seems, prefer nibbling at dips like cautious gourmands, not charging bulls.
Oscillators, those mood rings of the market, radiate neutrality. RSI at 52.4-neither mania nor despair, just the humdrum of a Monday morning. Stochastic at 65.2, MACD shrugging-this is the technical equivalent of a collective yawn. Two indicators lean negative; the rest sip tea, debating whether to care.
Moving averages? Short-term ones flirt below price, whispering sweet nothings like “I support you.” But long-term averages loom overhead like a disapproving dowager: EMA (50) at $72,924, EMA (200) at $88,323-levels that scoff at Bitcoin’s “ambitions.”
Bull Verdict:
Bitcoin “leans cautiously constructive,” a phrase as bold as a beige wallpaper. Higher lows! Neutral oscillators! If it breaches $72,000, the $74,000 ceiling beckons-though it may as well be Narnia for all the chance it has.
Bear Verdict:
Should the $69,000 “support” crumble-a level tested more than a suspect alibi-downside awaits at $67,800, $66,000, and perhaps the “broad range” of $64,000. The market’s version of a horror film sequel: no original ideas, just recycled fear.
FAQ 🔎
- What is Bitcoin’s price on March 12, 2026?
$70,523-stable as a butler’s composure during a garden party rainstorm. - What do Bitcoin’s technical indicators show?
A neutral shrug. The market’s mood? “Meh.” - Key support/resistance?
Support at $69,000 (a rope bridge) and resistance at $71,100-$72,000 (a locked vault). - Up or down short-term?
Higher lows! A timid step toward the chandelier… or the exit.
Read More
- LSETH PREDICTION. LSETH cryptocurrency
- AVAX PREDICTION. AVAX cryptocurrency
- GBP RUB PREDICTION
- EUR TRY PREDICTION
- USD CLP PREDICTION
- DOGE PREDICTION. DOGE cryptocurrency
- USD ZAR PREDICTION
- USD RUB PREDICTION
- EUR MXN PREDICTION
- TIA PREDICTION. TIA cryptocurrency
2026-03-12 15:58