Gentle audience, in this fevered theatre of crypto, Bitcoin parades a comédie of drama and doubt. A wild minuet between 74,532 and 78,610 sets the tune, while volume-that boisterous chœur-proclaims a grand 86.03 billion, for what is a day in this digital scene without a pinch of panache? The market cap plants its standard at 1.55 trillion, yet behind the velvet curtain the charts murmur caution. With signals flaring in every direction across timeframes, this is no ordinary promenade in the realm of figures.
Bitcoin Chart Outlook
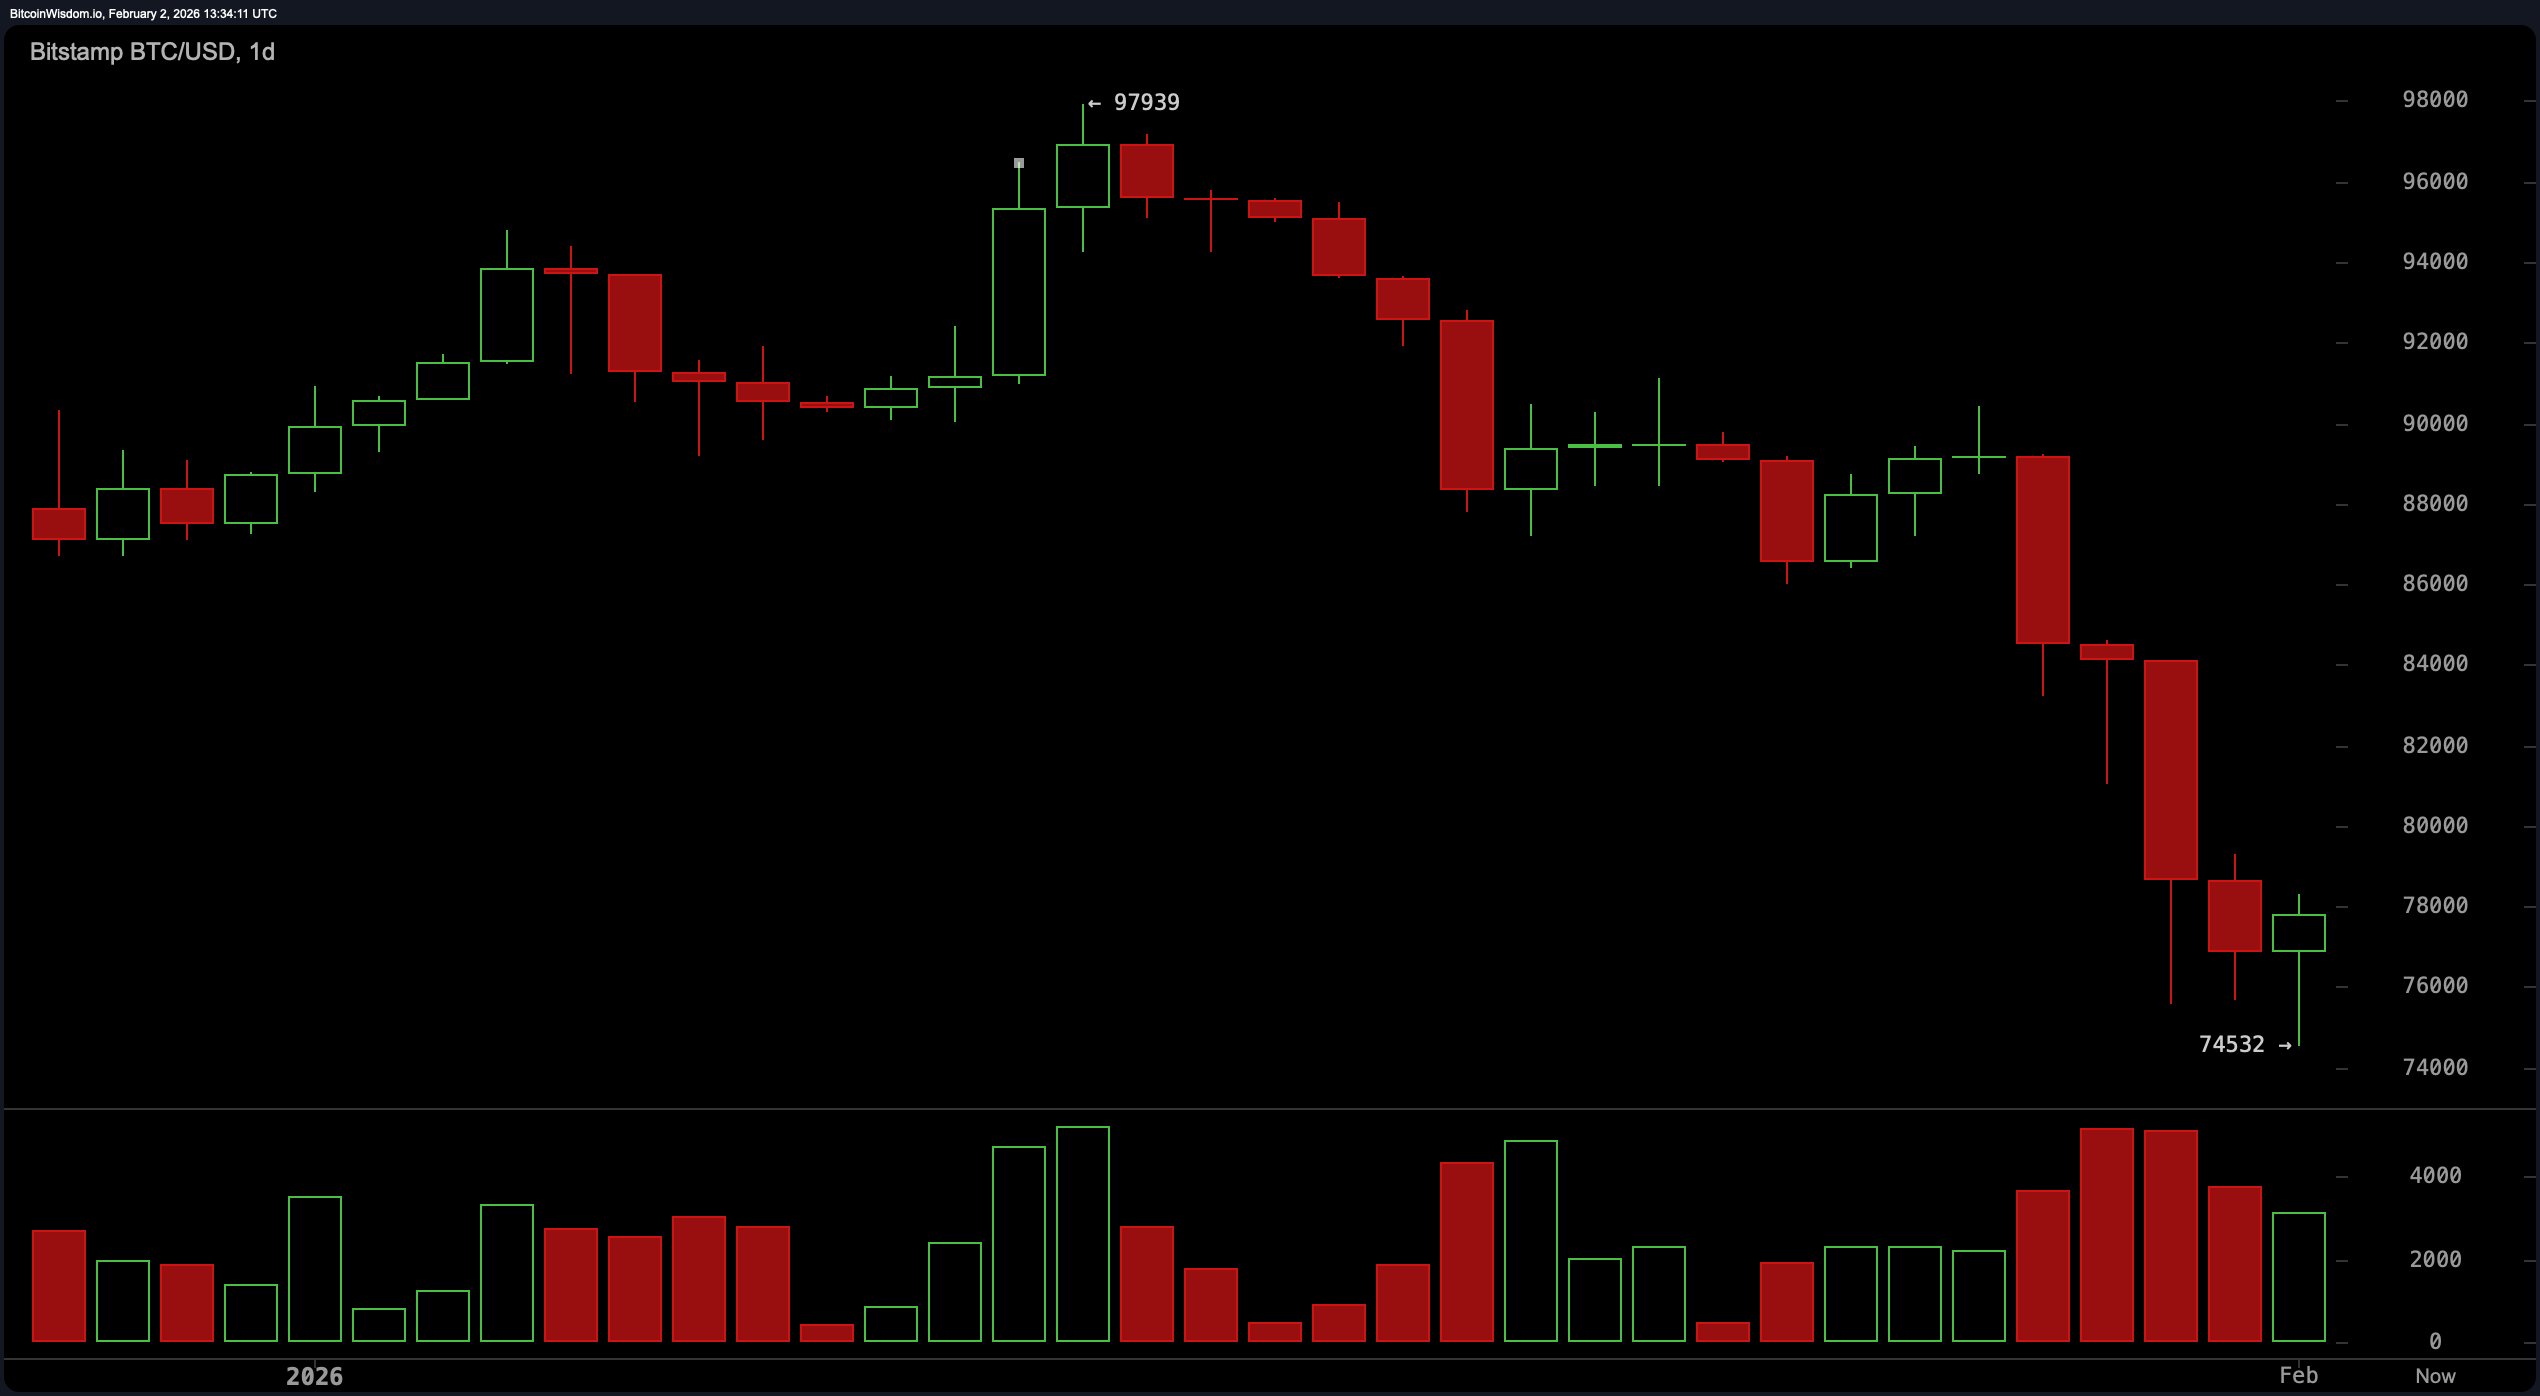
The daily chart doth cry, “I have fallen, and I cannot rise again.” Bitcoin staggers from a failed ascent near 97,900, now far beneath the noble moving averages, and the trend structure doth confess a breakdown. A pair of lower highs and lower lows reads as a textbook bearish tragedy, n’est-ce pas?
Support arrives at the line of 74,000 and 74,500, a stake in the sand for our pixelated hero, while any grand ascent would require a bold reclaim of 82,000. Elevated sell-side volume on the breakdown versus meek participation on the bounce betrays weak conviction from the bulls, who appear to nurse their wounds rather than march back to the masque of glory.
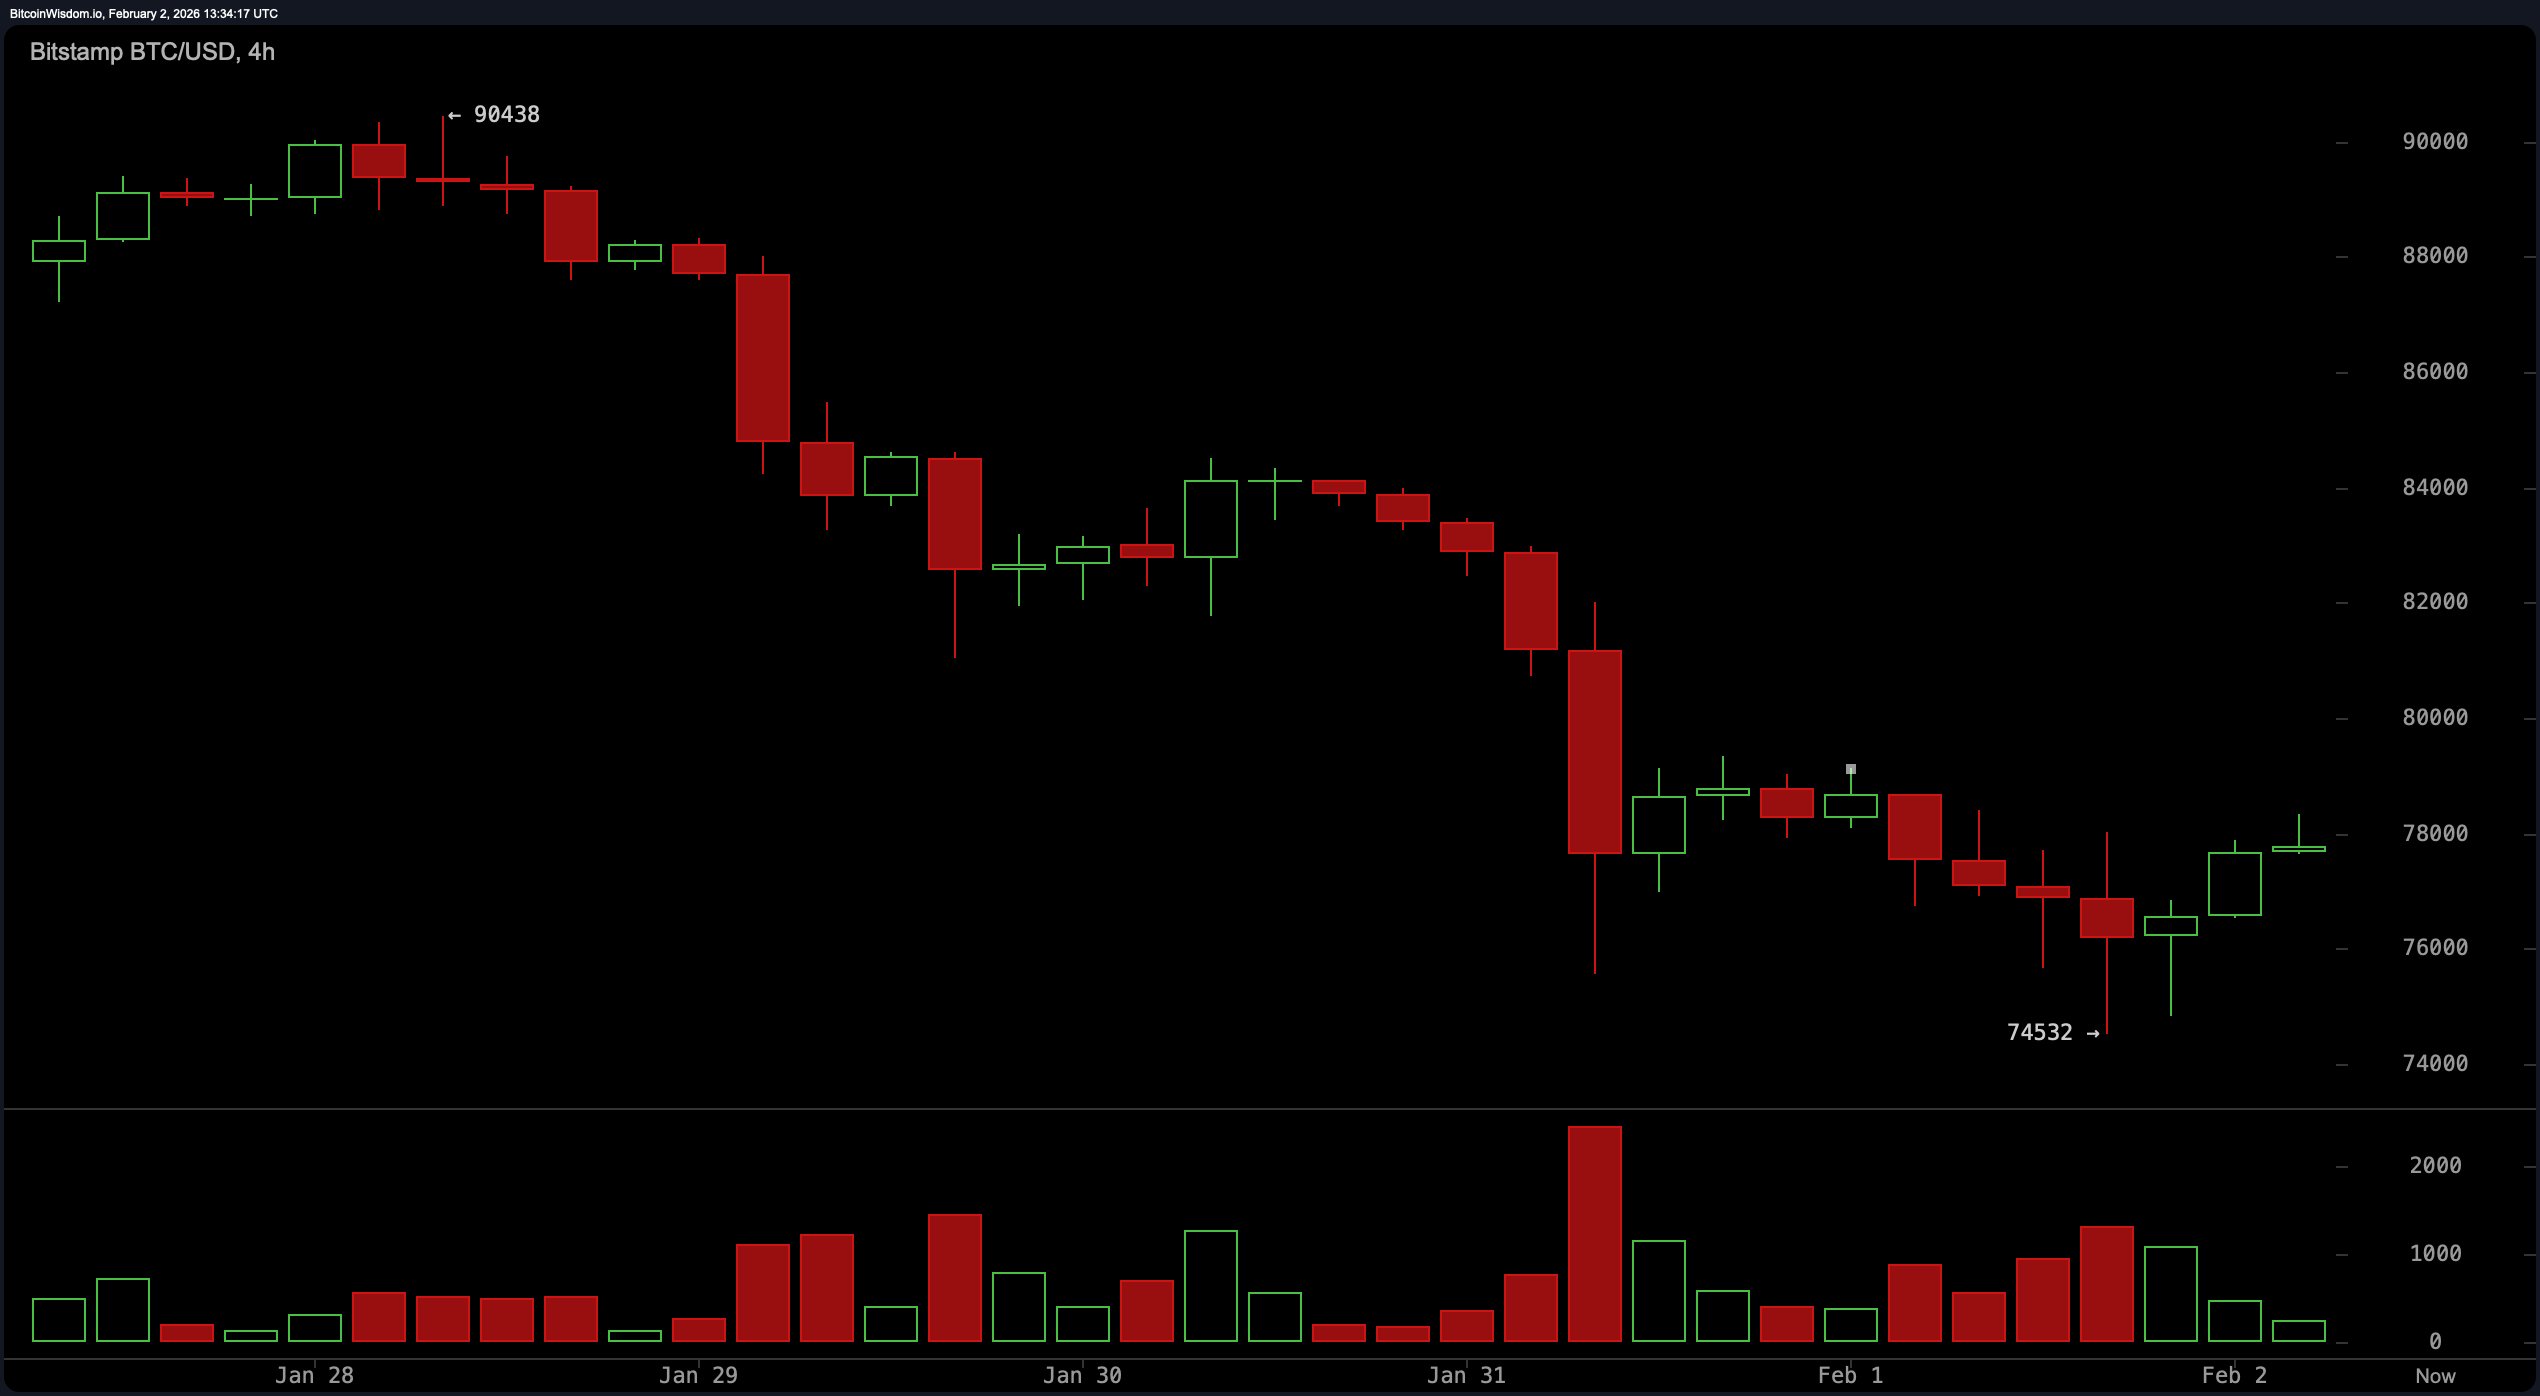
On the 4-hour chart, there’s a breath of optimism-but let us not dash to the champagne cellar. The price carves out a tentative base around 74,500, managing to print some higher lows as if attempting to reassemble itself after a crypto hangover. Still, the bounce resembles a light jog more than a gallop; momentum is hushed and resistance lurks overhead between 79,000 and 81,500. Price compression in the 76,000 to 79,000 zone proclaims a short-term decision theatre, and any bold action must be followed by cleaner proof. Until then, a holding pattern, not a triumphant refrain, governs the stage.
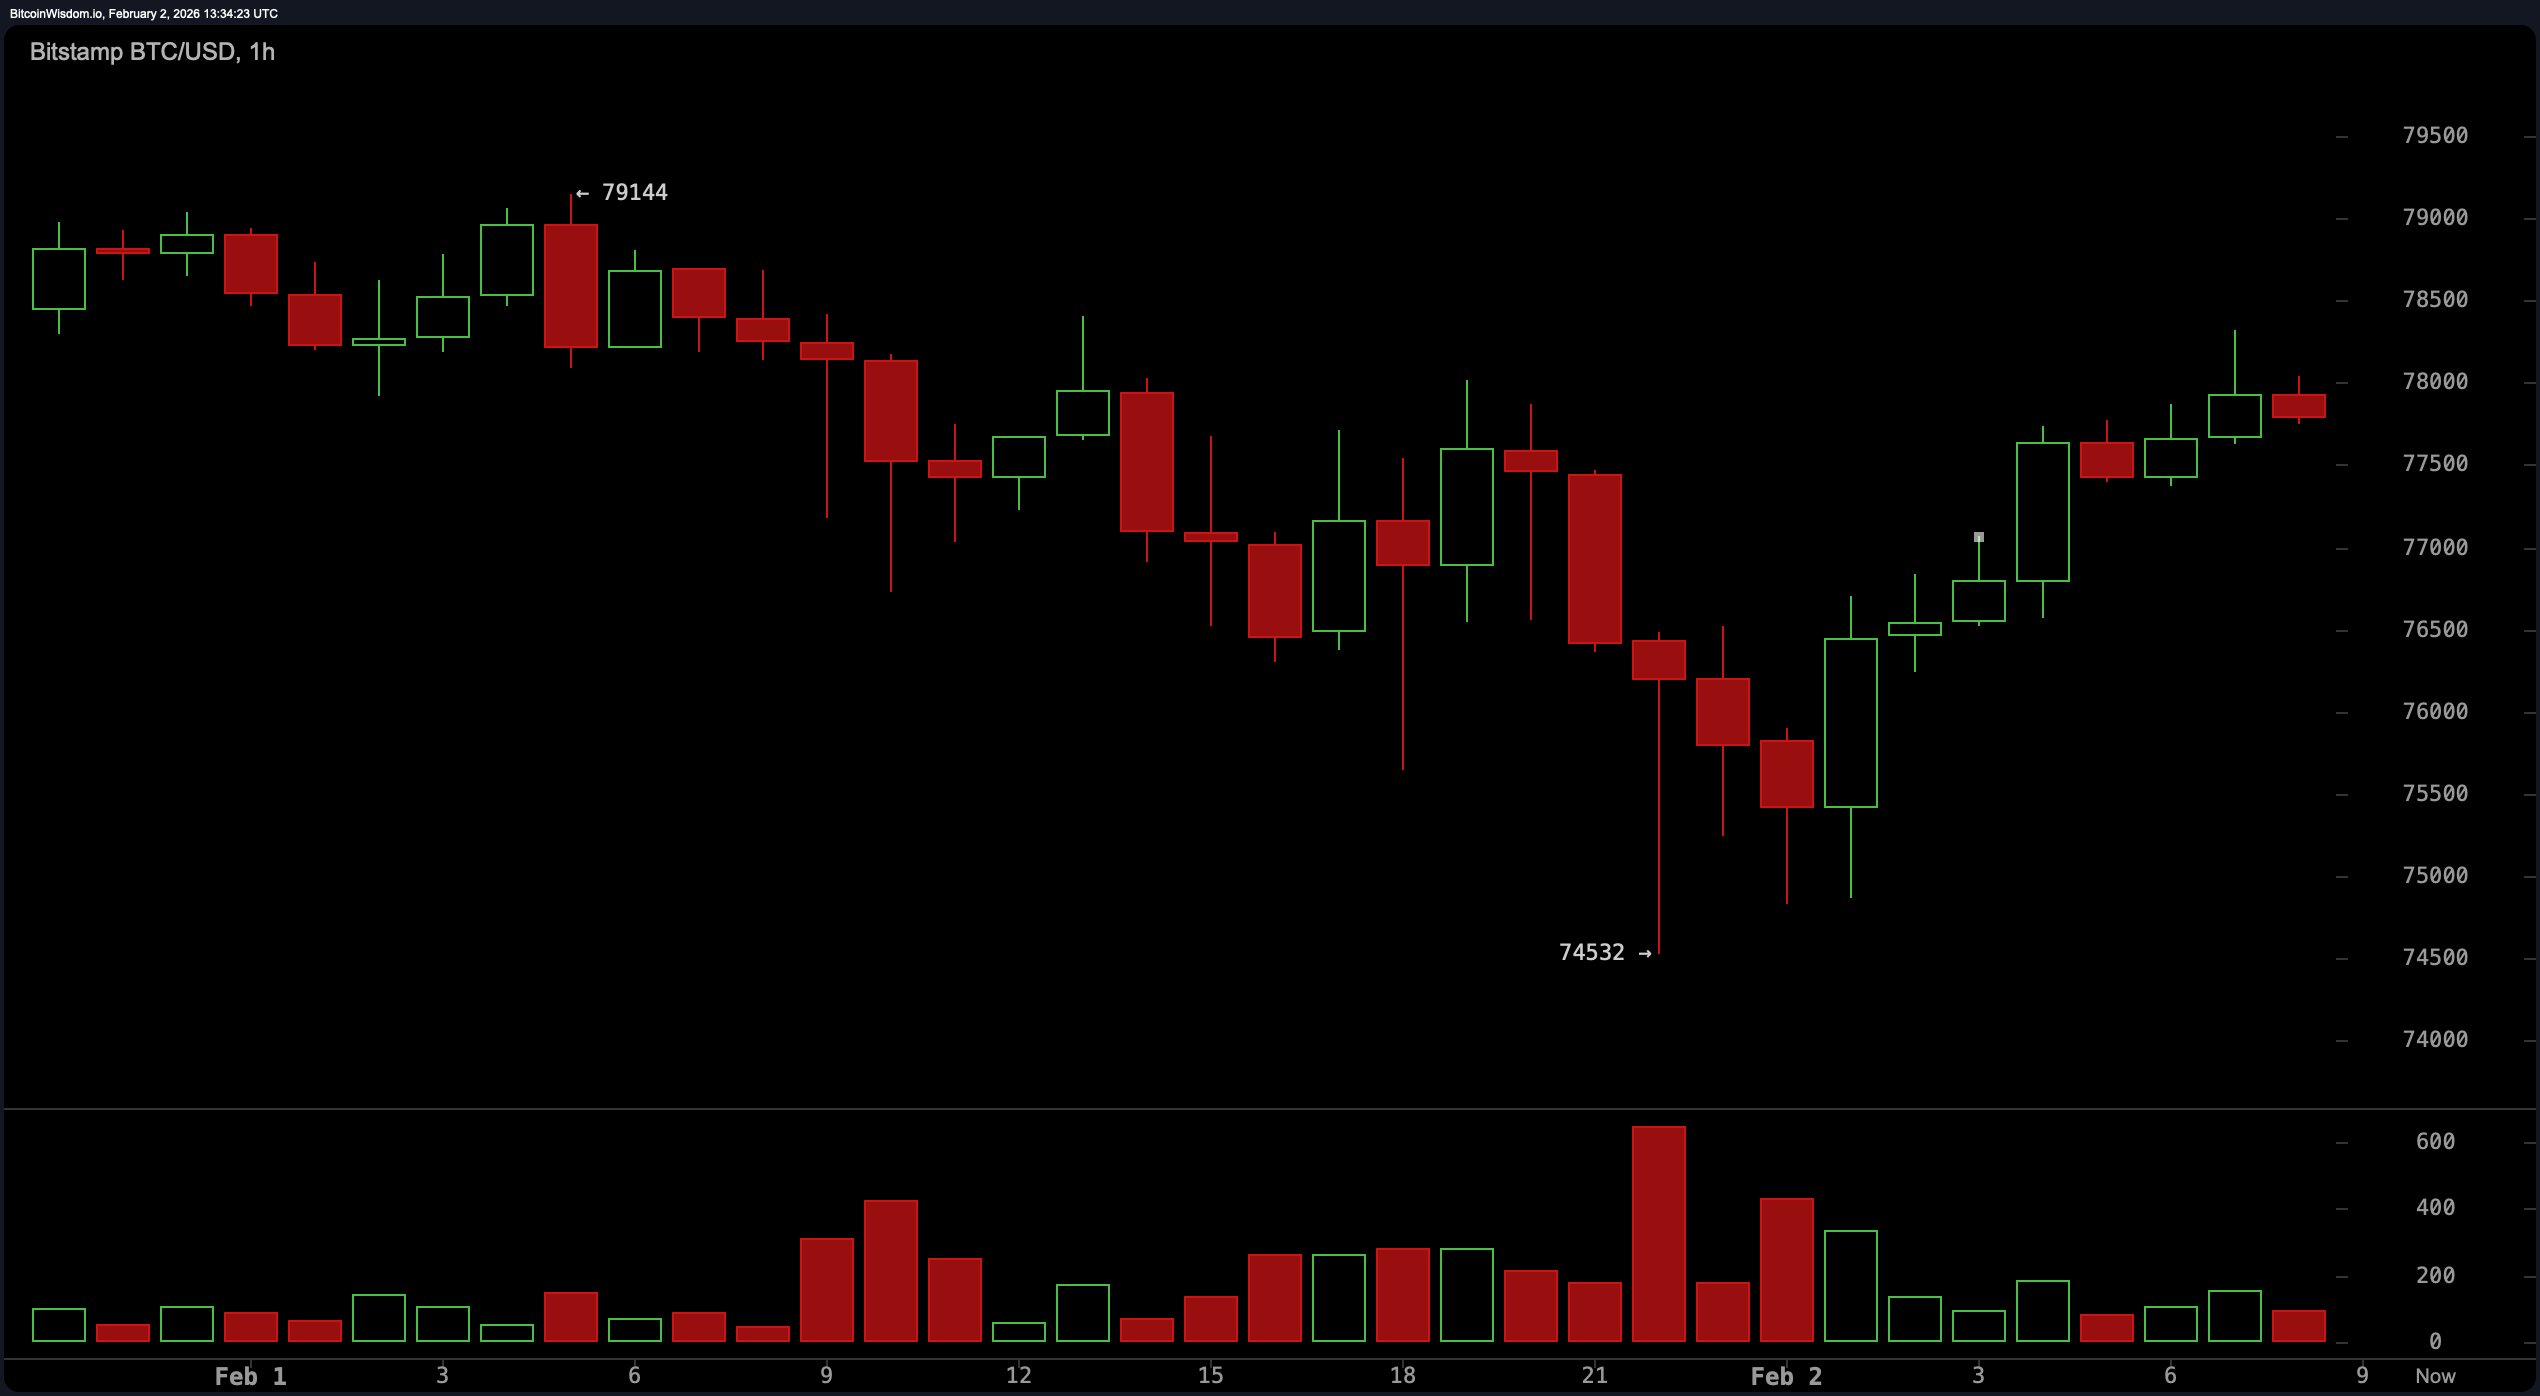
Zooming into the 1-hour chart, bitcoin stages what looks like a short-term recovery, climbing from a local low of 74,532. Tactical bulls arrive with higher lows and setups around 75,500 to 76,200. But the rally keeps kissing the ceiling at 78,500-79,200, where sellers return with clockwork punctuality. Buyers appear, yes-but those candles near resistance are tiptoeing, not charging. In sum: the bounce is real, yet the commitment remains a polite bow rather than a bold advance.
Oscillator signals are as mixed as a bag of altcoins at a meme-coin salon. The RSI sits at 27, nudging Bitcoin toward the door of oversold territory. The CCI coughs up a deeply negative read at -183, echoing exhaustion. The momentum oscillator writes a heavy -11,674, while the MACD (moving average convergence divergence) sighs at -3,039, tilting toward the downside. The Stochastic and the ADX hover in neutral purgatory, awaiting the price to declare its preference.
Then come the moving averages, and they spare no punches. Every major EMA and SMA-from 10 to 200 periods-loftily sits above the current price, delivering a collective shrug to bullish arguments. The 10-period EMA at 83,253 and the 200-period SMA towering at 103,737 form a chasm of resistance. Technically, this paints Bitcoin in a confirmed downtrend unless something revelatory occurs to push price back above at least 82,000. Until then, the averages are not merely unkind-they are downright dismissive.
In sum, the charts convey one message: the bounce is but a wavering conspirator, held fast by the fragile thread of 74,000.
Bull Verdict:
Should Bitcoin keep its footing at 74,000 to 74,500 and muster the vigor to reclaim 82,000 with conviction, the groundwork is laid for a genuine revival. The short-term higher lows and momentum stabilization in intraday charts grant cautious hope to bullish traders. Oversold oscillators whisper that downside momentum may be spent-for the nonce. Yet the bulls shall require volume, not mere vibes, to turn the page and reverse the misfortune.
Bear Verdict:
Below 82,000, the trend remains grievously wounded-and below 74,500, the floor doth vanish. The stacked moving averages sketch a portrait of weakness, while the daily breakdown signals distribution, not accumulation. Oscillators murmur oversold, but momentum and MACD declare the pain may endure. Until buyers reclaim key levels with real force, this bounce risks becoming but a dead cat in a fashionable fur.
FAQ ❓
- What is bitcoin’s price on February 2, 2026?
Bitcoin is trading at $77,870. - What key support level are traders watching?
$74,500 starts the critical support zone on all major timeframes. - Is bitcoin showing bullish or bearish signals?
Most indicators point to a bearish-to-neutral outlook below $82,000. - What’s the trading volume for bitcoin in the past 24 hours?
24-hour volume stands at $86.03 billion.
Read More
- Monero: The Bull, the Bear, and the $500 Dilemma – What’s Next?
- CRV PREDICTION. CRV cryptocurrency
- EUR GBP PREDICTION
- GBP CNY PREDICTION
- USD CAD PREDICTION
- EUR NZD PREDICTION
- USD COP PREDICTION
- WLFI: Whales, Woes, and a $0.10 Cliffhanger – Will It Sink or Swim?
- Wall Street’s Oil Gamble: $100 & Chaos
- Ripple’s $50B Dream: IPO or Mirage?
2026-02-02 18:03