Solana investors are facing a tough question after weeks of falling prices and unsuccessful attempts to bounce back. Is the current stability a sign that a big price increase is coming, or will prices continue to fall soon?
Solana’s price is currently around $116, and the market is nearing a critical moment where a clear direction will emerge. The conversation has shifted from whether Solana will go up or down, and is now focused on understanding the underlying market patterns and price movements.
Why This Zone Matters More Than It Looks
Looking at the data, while things still seem to be moving forward, I’m seeing some underlying weaknesses that suggest this positive trend might not last. It feels a bit unstable right now.
Looking at the weekly chart, the Relative Strength Index (RSI) is around 36, which is just slightly above oversold levels. In the past, this often suggests that selling pressure is weakening, especially if the price stays above a key support area. The Moving Average Convergence Divergence (MACD) is still below its signal line, but the histogram is starting to flatten out, indicating that the downward trend is losing steam.
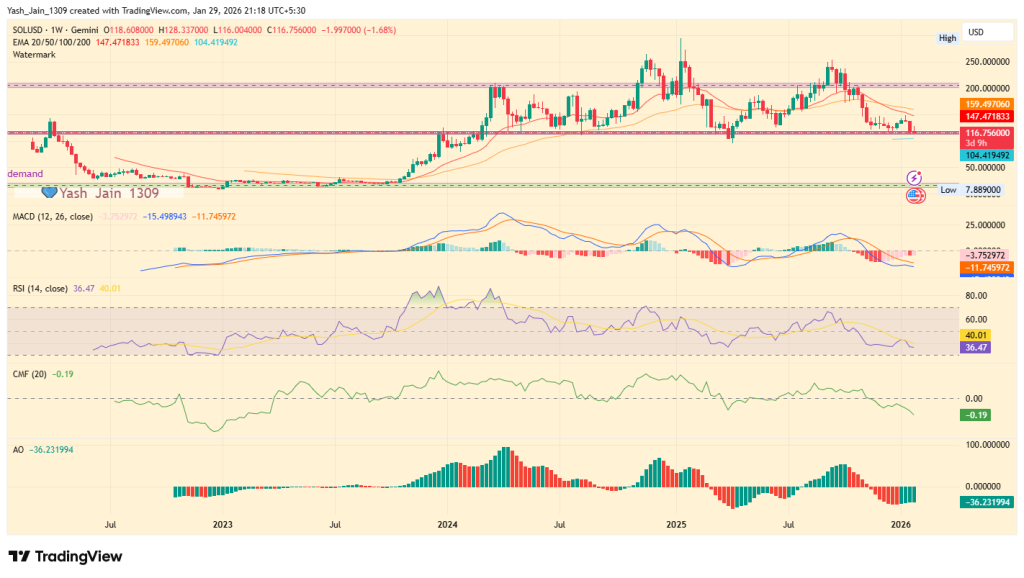
The Awesome Oscillator supports this idea. While still negative, the red bars on the indicator are getting smaller, suggesting that selling pressure is weakening. Meanwhile, Chaikin Money Flow is around -0.19, which indicates money is flowing out, but not in a panicked rush. Historically, similar patterns in Chaikin Money Flow during periods of stable prices have often been followed by increased price swings.
Looking at Solana’s price movement, it’s currently at $116, a key level where the price has historically bounced and started bigger rallies over the past two years. This suggests potential for further upward movement.
The On-Chain Signal Most Are Missing
While Solana price charts suggest hesitation, on-chain data paints a very different picture.
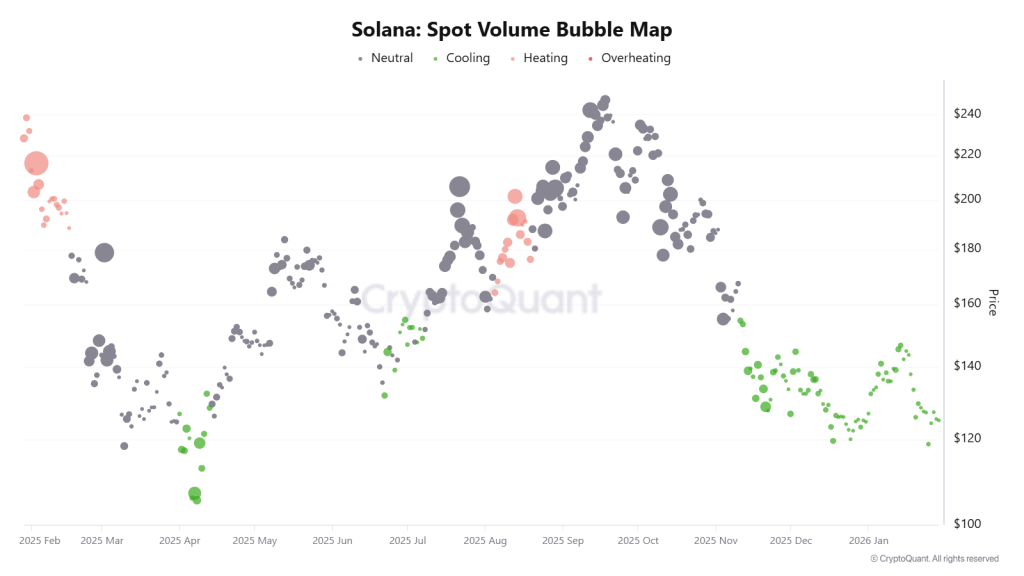
Our analysis of trading volume, using both spot and futures data, reveals a concentrated area of high activity between $110 and $150, which usually happens when the market is calming down. This suggests that strong investors are steadily buying, rather than the market being driven by speculation, while price swings remain relatively small.
Recent derivatives data supports the idea of a strengthening market. The Spot Taker CVD is now positive and increasing, showing that buyers have been in control since the beginning of January. Importantly, the Futures Taker CVD has been consistently positive since December 2025, indicating that large institutions are confident in the market’s long-term potential, not just making quick trades.
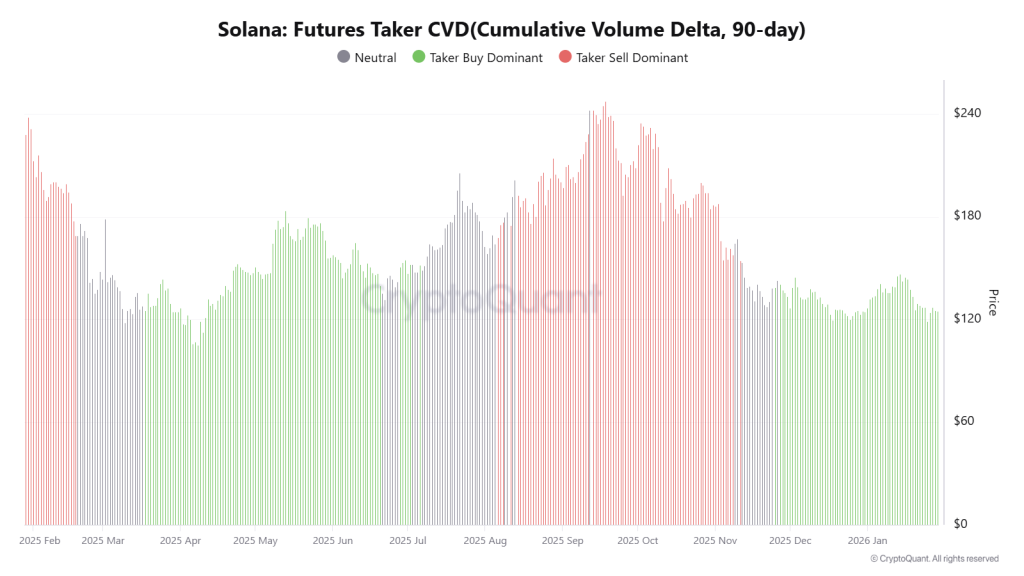
When both current (spot) and future demand show similar patterns around a crucial support level, it often suggests the market is preparing for a significant price change.
The Levels That Decide the Outcome
If buyers defend current levels:
First upside SOL/USD target: $135, where short-term resistance and EMA pressure converge
Breakout confirmation: $150–$180, aligned with heavy on-chain accumulation zones
If support gives way:
Immediate downside risk: $104, a prior weekly demand shelf
Deeper breakdown zone: $88–$95, the last structural base before the 2024 expansion leg
Currently, the price of SOL seems poised to break out of its recent stable pattern. Once it moves past this point, it will clearly establish a new upward or downward trend.
Read More
- PayPal’s PYUSD: World Domination or Just Another Coin Flip?
- USD DKK PREDICTION
- 🚀 XRP’s Rocket Ride: From Wallets to Your Stock Portfolio! 🚀
- GBP CHF PREDICTION
- SOL PREDICTION. SOL cryptocurrency
- ETC PREDICTION. ETC cryptocurrency
- XDC PREDICTION. XDC cryptocurrency
- Lithuania’s Crypto Crackdown: Compliance or Chaos? 🏛️💥
- Crypto Drama: Why Is ARB Playing Hard to Get in 2026?
- Trump & Crypto: Revolution or Robbery? 😱 $800M Drama!
2026-01-29 20:18